Postprocessing
The postprocessing module provides functions to combine CMIP6 datasets (provided in a dictionary) based on their dataset attributes. We provide some general, highly customizable function combine_datasets, but also some simpler wrappers for often-used functionality like merging variables, concatenating members and even parsing metric coordinates (given in a seperate dictionary of datasets).
This functionality overlaps to a degree with the approach taken in intake-esm, but provides more flexibility to predetermine the order of operations and crucially, custom functions can be applied at every step.
You can still use intake-esm, but for this functionality to work please specify
aggregate=Falseas below.
[10]:
# lets start by loading a few example dataset
from xmip.utils import google_cmip_col
from xmip.preprocessing import combined_preprocessing

col = google_cmip_col()
experiment_id='historical'
source_id = ['CanESM5-CanOE', 'GFDL-ESM4']
kwargs = {
    'zarr_kwargs':{
        'consolidated':True,
        'use_cftime':True
    },
    'aggregate':False,
    'preprocess':combined_preprocessing
}

cat_data = col.search(
    source_id=source_id,
    experiment_id=experiment_id,
    grid_label='gn',
    table_id='Omon',
    variable_id=['tos', 'zos']
)
ddict = cat_data.to_dataset_dict(**kwargs)
list(ddict.keys())
--> The keys in the returned dictionary of datasets are constructed as follows:
        'activity_id.institution_id.source_id.experiment_id.member_id.table_id.variable_id.grid_label.zstore.dcpp_init_year.version'
[10]:
['CMIP.CCCma.CanESM5-CanOE.historical.r2i1p2f1.Omon.tos.gn.gs://cmip6/CMIP6/CMIP/CCCma/CanESM5-CanOE/historical/r2i1p2f1/Omon/tos/gn/v20190429/.nan.20190429',
 'CMIP.CCCma.CanESM5-CanOE.historical.r1i1p2f1.Omon.zos.gn.gs://cmip6/CMIP6/CMIP/CCCma/CanESM5-CanOE/historical/r1i1p2f1/Omon/zos/gn/v20190429/.nan.20190429',
 'CMIP.CCCma.CanESM5-CanOE.historical.r3i1p2f1.Omon.tos.gn.gs://cmip6/CMIP6/CMIP/CCCma/CanESM5-CanOE/historical/r3i1p2f1/Omon/tos/gn/v20190429/.nan.20190429',
 'CMIP.CCCma.CanESM5-CanOE.historical.r3i1p2f1.Omon.zos.gn.gs://cmip6/CMIP6/CMIP/CCCma/CanESM5-CanOE/historical/r3i1p2f1/Omon/zos/gn/v20190429/.nan.20190429',
 'CMIP.NOAA-GFDL.GFDL-ESM4.historical.r3i1p1f1.Omon.zos.gn.gs://cmip6/CMIP6/CMIP/NOAA-GFDL/GFDL-ESM4/historical/r3i1p1f1/Omon/zos/gn/v20180701/.nan.20180701',
 'CMIP.NOAA-GFDL.GFDL-ESM4.historical.r1i1p1f1.Omon.zos.gn.gs://cmip6/CMIP6/CMIP/NOAA-GFDL/GFDL-ESM4/historical/r1i1p1f1/Omon/zos/gn/v20190726/.nan.20190726',
 'CMIP.NOAA-GFDL.GFDL-ESM4.historical.r2i1p1f1.Omon.tos.gn.gs://cmip6/CMIP6/CMIP/NOAA-GFDL/GFDL-ESM4/historical/r2i1p1f1/Omon/tos/gn/v20180701/.nan.20180701',
 'CMIP.NOAA-GFDL.GFDL-ESM4.historical.r1i1p1f1.Omon.tos.gn.gs://cmip6/CMIP6/CMIP/NOAA-GFDL/GFDL-ESM4/historical/r1i1p1f1/Omon/tos/gn/v20190726/.nan.20190726',
 'CMIP.CCCma.CanESM5-CanOE.historical.r2i1p2f1.Omon.zos.gn.gs://cmip6/CMIP6/CMIP/CCCma/CanESM5-CanOE/historical/r2i1p2f1/Omon/zos/gn/v20190429/.nan.20190429',
 'CMIP.CCCma.CanESM5-CanOE.historical.r1i1p2f1.Omon.tos.gn.gs://cmip6/CMIP6/CMIP/CCCma/CanESM5-CanOE/historical/r1i1p2f1/Omon/tos/gn/v20190429/.nan.20190429',
 'CMIP.NOAA-GFDL.GFDL-ESM4.historical.r3i1p1f1.Omon.tos.gn.gs://cmip6/CMIP6/CMIP/NOAA-GFDL/GFDL-ESM4/historical/r3i1p1f1/Omon/tos/gn/v20180701/.nan.20180701',
 'CMIP.NOAA-GFDL.GFDL-ESM4.historical.r2i1p1f1.Omon.zos.gn.gs://cmip6/CMIP6/CMIP/NOAA-GFDL/GFDL-ESM4/historical/r2i1p1f1/Omon/zos/gn/v20180701/.nan.20180701']
You can see that the dictionary contains data from different models, ensemble members, and two variables: zos (sea surface height) and tos (sea surface temperature).
Lets go through a couple of steps here to reduce these to two model datasets (each model should be one xarray dataset with both variables and concatenated members).
Merging variables
First lets merge the variables (currently in a dataset each) into a single dataset.
[11]:
from xmip.postprocessing import merge_variables

ddict_merged = merge_variables(ddict)
list(ddict_merged.keys())
[11]:
['CanESM5-CanOE.gn.historical.Omon.r2i1p2f1',
 'CanESM5-CanOE.gn.historical.Omon.r1i1p2f1',
 'CanESM5-CanOE.gn.historical.Omon.r3i1p2f1',
 'GFDL-ESM4.gn.historical.Omon.r3i1p1f1',
 'GFDL-ESM4.gn.historical.Omon.r1i1p1f1',
 'GFDL-ESM4.gn.historical.Omon.r2i1p1f1']
The keys have been replaced by an identifier based on the unique attributes that differntiate each of the datasets, but not the variable name anymore.
[12]:
# check if the merging worked
ddict_merged['GFDL-ESM4.gn.historical.Omon.r2i1p1f1']
[12]:
<xarray.Dataset>
Dimensions:        (time: 1980, y: 576, x: 720, vertex: 4, bnds: 2)
Coordinates:
  * x              (x) float64 -299.8 -299.2 -298.8 -298.2 ... 58.75 59.25 59.75
  * y              (y) float64 -77.91 -77.72 -77.54 -77.36 ... 89.47 89.68 89.89
    lat            (y, x) float32 dask.array<chunksize=(576, 720), meta=np.ndarray>
    lat_verticies  (y, x, vertex) float32 dask.array<chunksize=(576, 720, 4), meta=np.ndarray>
    lon            (y, x) float32 dask.array<chunksize=(576, 720), meta=np.ndarray>
    lon_verticies  (y, x, vertex) float32 dask.array<chunksize=(576, 720, 4), meta=np.ndarray>
  * time           (time) object 1850-01-16 12:00:00 ... 2014-12-16 12:00:00
    time_bounds    (time, bnds) object dask.array<chunksize=(1980, 2), meta=np.ndarray>
    lon_bounds     (bnds, y, x) float32 dask.array<chunksize=(1, 576, 720), meta=np.ndarray>
    lat_bounds     (bnds, y, x) float32 dask.array<chunksize=(1, 576, 720), meta=np.ndarray>
Dimensions without coordinates: vertex, bnds
Data variables:
    tos            (time, y, x) float32 dask.array<chunksize=(64, 576, 720), meta=np.ndarray>
    zos            (time, y, x) float32 dask.array<chunksize=(61, 576, 720), meta=np.ndarray>
Attributes: (12/47)
    Conventions:            CF-1.7 CMIP-6.0 UGRID-1.0
    activity_id:            CMIP
    branch_method:          standard
    branch_time_in_child:   0.0
    branch_time_in_parent:  54750.0
    comment:                <null ref>
    ...                     ...
    title:                  NOAA GFDL GFDL-ESM4 model output prepared for CMI...
    variant_info:           N/A
    variant_label:          r2i1p1f1
    version_id:             v20180701
    intake_esm_varname:     None
original_key: CMIP.NOAA-GFDL.GFDL-ESM4.historical.r2i1p1f1.Omon...You can see that the datasets now in fact contain both variables in a single dataset.
Lets keep going. Since these members are all of the same length (might not be true for all CMIP6 models!) we can simply concatenate them along a new dimension:
[14]:
from xmip.postprocessing import concat_members
ddict_concat = concat_members(ddict_merged)
print(list(ddict_concat.keys()))
ddict_concat['GFDL-ESM4.gn.historical.Omon']
/home/jovyan/2_AREAS/xmip/xmip/postprocessing.py:113: UserWarning: Match attributes ['variable_id'] not found in any of the datasets. This can happen when several combination functions are used.
warnings.warn(
['CanESM5-CanOE.gn.historical.Omon', 'GFDL-ESM4.gn.historical.Omon']
[14]:
<xarray.Dataset>
Dimensions: (member_id: 3, time: 1980, y: 576, x: 720, vertex: 4, bnds: 2)
Coordinates:
* x (x) float64 -299.8 -299.2 -298.8 -298.2 ... 58.75 59.25 59.75
* y (y) float64 -77.91 -77.72 -77.54 -77.36 ... 89.47 89.68 89.89
lat (y, x) float32 -77.91 -77.91 -77.91 ... 65.39 65.18 64.97
lat_verticies (y, x, vertex) float32 -78.0 -77.82 -77.82 ... 64.87 64.87
lon (y, x) float32 60.25 60.75 61.25 61.75 ... 59.99 59.99 60.0
lon_verticies (y, x, vertex) float32 60.0 60.0 60.5 60.5 ... 60.0 60.0 60.0
* time (time) object 1850-01-16 12:00:00 ... 2014-12-16 12:00:00
time_bounds (time, bnds) object 1850-01-01 00:00:00 ... 2015-01-01 00:...
lon_bounds (bnds, y, x) float32 60.0 60.5 61.0 61.5 ... 59.99 60.0 60.0
lat_bounds (bnds, y, x) float32 -78.0 -78.0 -78.0 ... 65.39 65.18 64.97
* member_id (member_id) <U8 'r3i1p1f1' 'r1i1p1f1' 'r2i1p1f1'
Dimensions without coordinates: vertex, bnds
Data variables:
zos (member_id, time, y, x) float32 dask.array<chunksize=(1, 61, 576, 720), meta=np.ndarray>
tos (member_id, time, y, x) float32 dask.array<chunksize=(1, 64, 576, 720), meta=np.ndarray>
Attributes: (12/39)
Conventions: CF-1.7 CMIP-6.0 UGRID-1.0
activity_id: CMIP
branch_method: standard
branch_time_in_child: 0.0
comment: <null ref>
contact: gfdl.climate.model.info@noaa.gov
... ...
sub_experiment: none
sub_experiment_id: none
table_id: Omon
title: NOAA GFDL GFDL-ESM4 model output prepared for CMIP...
variant_info: N/A
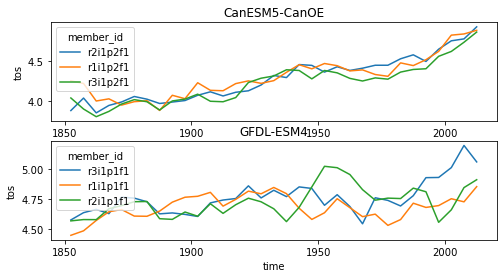
intake_esm_varname: NoneNow we have only one dataset per model and experiment, enableing us to apply some sort of analysis that depends on both variables easily. Here we plot the average SST where the SSH is smaller than 0 just for demonstration purposes.
[15]:
import matplotlib.pyplot as plt
plt.figure(figsize=[8,4])
for i, (name, ds) in enumerate(ddict_concat.items()):
data = ds.tos.where(ds.zos<0).mean(['x','y'])
plt.subplot(2,1,i+1)
data.coarsen(time=12*5).mean().plot(hue='member_id')
plt.gca().set_title(ds.attrs['source_id'])
Alternatively you could try to only choose a single member from each model using pick_first_member. This can be very helpful for prototyping an analysis, since some of the models have a large number of members and as such can increase computation time significantly!
[18]:
from xmip.postprocessing import pick_first_member
ddict_single_member = pick_first_member(ddict_merged)
print(list(ddict_single_member.keys()))
ddict_single_member['GFDL-ESM4.gn.historical.Omon']
['CanESM5-CanOE.gn.historical.Omon', 'GFDL-ESM4.gn.historical.Omon']
[18]:
<xarray.Dataset>
Dimensions: (time: 1980, y: 576, x: 720, vertex: 4, bnds: 2)
Coordinates:
* x (x) float64 -299.8 -299.2 -298.8 -298.2 ... 58.75 59.25 59.75
* y (y) float64 -77.91 -77.72 -77.54 -77.36 ... 89.47 89.68 89.89
lat (y, x) float32 dask.array<chunksize=(576, 720), meta=np.ndarray>
lat_verticies (y, x, vertex) float32 dask.array<chunksize=(576, 720, 4), meta=np.ndarray>
lon (y, x) float32 dask.array<chunksize=(576, 720), meta=np.ndarray>
lon_verticies (y, x, vertex) float32 dask.array<chunksize=(576, 720, 4), meta=np.ndarray>
* time (time) object 1850-01-16 12:00:00 ... 2014-12-16 12:00:00
time_bounds (time, bnds) object dask.array<chunksize=(1980, 2), meta=np.ndarray>
lon_bounds (bnds, y, x) float32 dask.array<chunksize=(1, 576, 720), meta=np.ndarray>
lat_bounds (bnds, y, x) float32 dask.array<chunksize=(1, 576, 720), meta=np.ndarray>
Dimensions without coordinates: vertex, bnds
Data variables:
zos (time, y, x) float32 dask.array<chunksize=(61, 576, 720), meta=np.ndarray>
tos (time, y, x) float32 dask.array<chunksize=(120, 576, 720), meta=np.ndarray>
Attributes: (12/46)
Conventions: CF-1.7 CMIP-6.0 UGRID-1.0
activity_id: CMIP
branch_method: standard
branch_time_in_child: 0.0
branch_time_in_parent: 36500.0
comment: <null ref>
... ...
title: NOAA GFDL GFDL-ESM4 model output prepared for CMI...
variant_info: N/A
variant_label: r1i1p1f1
version_id: v20190726
intake_esm_varname: None
original_key: GFDL-ESM4.gn.historical.Omon.r1i1p1f1Custom combination functions
There might be cases where the convenience wrappers are not exactly flexible enough. In that case you can always use combine_datasets with a custom function. This function takes a list of ‘matched’ xarray.Datasets as input. The matching is done by providing the attributes which should be the same in all of the matched datasets.
A common use case could be to pick just any single member from a model. This helps in developing analyses for many models without having to compute all of them at the initial stage.
[15]:
from xmip.postprocessing import combine_datasets
def pick_first_member(ds_list, **kwargs):
return ds_list[0]
ddict_new = combine_datasets(
ddict_merged,
pick_first_member,
match_attrs=['source_id', 'grid_label', 'experiment_id', 'table_id']
)
ddict_new['CanESM5-CanOE.gn.historical.Omon']
[15]:
<xarray.Dataset>
Dimensions: (bnds: 2, time: 1980, vertex: 4, x: 360, y: 291)
Coordinates:
* x (x) int32 0 1 2 3 4 5 6 7 ... 352 353 354 355 356 357 358 359
* y (y) int32 0 1 2 3 4 5 6 7 ... 283 284 285 286 287 288 289 290
lat (y, x) float64 dask.array<chunksize=(291, 360), meta=np.ndarray>
lon (y, x) float64 dask.array<chunksize=(291, 360), meta=np.ndarray>
* time (time) object 1850-01-16 12:00:00 ... 2014-12-16 12:00:00
time_bounds (time, bnds) object dask.array<chunksize=(1980, 2), meta=np.ndarray>
lat_verticies (y, x, vertex) float64 dask.array<chunksize=(291, 360, 4), meta=np.ndarray>
lon_verticies (y, x, vertex) float64 dask.array<chunksize=(291, 360, 4), meta=np.ndarray>
* bnds (bnds) int64 0 1
* vertex (vertex) int64 0 1 2 3
lon_bounds (bnds, y, x) float64 dask.array<chunksize=(1, 291, 360), meta=np.ndarray>
lat_bounds (bnds, y, x) float64 dask.array<chunksize=(1, 291, 360), meta=np.ndarray>
Data variables:
tos (time, y, x) float32 dask.array<chunksize=(215, 291, 360), meta=np.ndarray>
zos (time, y, x) float32 dask.array<chunksize=(208, 291, 360), meta=np.ndarray>
Attributes: (12/52)
CCCma_model_hash: 932b659de600c6a0e94f619abaf9cc79eabcd337
CCCma_parent_runid: canoecpl-007
CCCma_pycmor_hash: 3ecdc18eb7c1f7fbce0346850f41adf815d9fb66
CCCma_runid: c2-his02
Conventions: CF-1.7 CMIP-6.2
YMDH_branch_time_in_child: 1850:01:01:00
... ...
title: CanESM5-CanOE output prepared for CMIP6
variant_label: r2i1p2f1
version: v20190429
version_id: v20190429
intake_esm_varname: None
original_key: CMIP.CCCma.CanESM5-CanOE.historical.r2i1p2f1...- bnds: 2
- time: 1980
- vertex: 4
- x: 360
- y: 291
- x(x)int320 1 2 3 4 5 ... 355 356 357 358 359
- long_name :
- cell index along first dimension
- units :
- 1
array([ 0, 1, 2, ..., 357, 358, 359], dtype=int32)
- y(y)int320 1 2 3 4 5 ... 286 287 288 289 290
- long_name :
- cell index along second dimension
- units :
- 1
array([ 0, 1, 2, ..., 288, 289, 290], dtype=int32)
- lat(y, x)float64dask.array<chunksize=(291, 360), meta=np.ndarray>
- bounds :
- vertices_latitude
- long_name :
- latitude
- standard_name :
- latitude
- units :
- degrees_north
Array Chunk Bytes 838.08 kB 838.08 kB Shape (291, 360) (291, 360) Count 6 Tasks 1 Chunks Type float64 numpy.ndarray - lon(y, x)float64dask.array<chunksize=(291, 360), meta=np.ndarray>
- bounds :
- vertices_longitude
- long_name :
- longitude
- standard_name :
- longitude
- units :
- degrees_east
Array Chunk Bytes 838.08 kB 838.08 kB Shape (291, 360) (291, 360) Count 9 Tasks 1 Chunks Type float64 numpy.ndarray - time(time)object1850-01-16 12:00:00 ... 2014-12-...
- axis :
- T
- bounds :
- time_bnds
- long_name :
- time
- standard_name :
- time
array([cftime.DatetimeNoLeap(1850, 1, 16, 12, 0, 0, 0), cftime.DatetimeNoLeap(1850, 2, 15, 0, 0, 0, 0), cftime.DatetimeNoLeap(1850, 3, 16, 12, 0, 0, 0), ..., cftime.DatetimeNoLeap(2014, 10, 16, 12, 0, 0, 0), cftime.DatetimeNoLeap(2014, 11, 16, 0, 0, 0, 0), cftime.DatetimeNoLeap(2014, 12, 16, 12, 0, 0, 0)], dtype=object) - time_bounds(time, bnds)objectdask.array<chunksize=(1980, 2), meta=np.ndarray>
Array Chunk Bytes 31.68 kB 31.68 kB Shape (1980, 2) (1980, 2) Count 3 Tasks 1 Chunks Type object numpy.ndarray - lat_verticies(y, x, vertex)float64dask.array<chunksize=(291, 360, 4), meta=np.ndarray>
- units :
- degrees_north
Array Chunk Bytes 3.35 MB 3.35 MB Shape (291, 360, 4) (291, 360, 4) Count 4 Tasks 1 Chunks Type float64 numpy.ndarray - lon_verticies(y, x, vertex)float64dask.array<chunksize=(291, 360, 4), meta=np.ndarray>
- units :
- degrees_east
Array Chunk Bytes 3.35 MB 3.35 MB Shape (291, 360, 4) (291, 360, 4) Count 7 Tasks 1 Chunks Type float64 numpy.ndarray - bnds(bnds)int640 1
array([0, 1])
- vertex(vertex)int640 1 2 3
array([0, 1, 2, 3])
- lon_bounds(bnds, y, x)float64dask.array<chunksize=(1, 291, 360), meta=np.ndarray>
Array Chunk Bytes 1.68 MB 838.08 kB Shape (2, 291, 360) (1, 291, 360) Count 17 Tasks 2 Chunks Type float64 numpy.ndarray - lat_bounds(bnds, y, x)float64dask.array<chunksize=(1, 291, 360), meta=np.ndarray>
Array Chunk Bytes 1.68 MB 838.08 kB Shape (2, 291, 360) (1, 291, 360) Count 14 Tasks 2 Chunks Type float64 numpy.ndarray
- tos(time, y, x)float32dask.array<chunksize=(215, 291, 360), meta=np.ndarray>
- cell_measures :
- area: areacello
- cell_methods :
- area: mean where sea time: mean
- comment :
- Temperature of upper boundary of the liquid ocean, including temperatures below sea-ice and floating ice shelves.
- long_name :
- Sea Surface Temperature
- original_name :
- sosstsst
- standard_name :
- sea_surface_temperature
- units :
- degC
Array Chunk Bytes 829.70 MB 90.09 MB Shape (1980, 291, 360) (215, 291, 360) Count 11 Tasks 10 Chunks Type float32 numpy.ndarray - zos(time, y, x)float32dask.array<chunksize=(208, 291, 360), meta=np.ndarray>
- cell_measures :
- area: areacello
- cell_methods :
- area: mean where sea time: mean
- comment :
- zos is obtained directly from the free-surface model., CMIP_table_comment: This is the dynamic sea level, so should have zero global area mean. It should not include inverse barometer depressions from sea ice.
- history :
- sub_timeseries
- long_name :
- Sea Surface Height Above Geoid
- original_name :
- sossheig
- standard_name :
- sea_surface_height_above_geoid
- units :
- m
Array Chunk Bytes 829.70 MB 87.16 MB Shape (1980, 291, 360) (208, 291, 360) Count 11 Tasks 10 Chunks Type float32 numpy.ndarray
- CCCma_model_hash :
- 932b659de600c6a0e94f619abaf9cc79eabcd337
- CCCma_parent_runid :
- canoecpl-007
- CCCma_pycmor_hash :
- 3ecdc18eb7c1f7fbce0346850f41adf815d9fb66
- CCCma_runid :
- c2-his02
- Conventions :
- CF-1.7 CMIP-6.2
- YMDH_branch_time_in_child :
- 1850:01:01:00
- YMDH_branch_time_in_parent :
- 5600:01:01:00
- activity_id :
- CMIP
- branch_method :
- Spin-up documentation
- branch_time_in_child :
- 0.0
- branch_time_in_parent :
- 1368750.0
- cmor_version :
- 3.5.0
- contact :
- ec.cccma.info-info.ccmac.ec@canada.ca
- data_specs_version :
- 01.00.31
- experiment :
- all-forcing simulation of the recent past
- experiment_id :
- historical
- external_variables :
- areacello
- forcing_index :
- 1
- frequency :
- mon
- further_info_url :
- https://furtherinfo.es-doc.org/CMIP6.CCCma.CanESM5-CanOE.historical.none.r2i1p2f1
- grid :
- ORCA1 tripolar grid, 1 deg with refinement to 1/3 deg within 20 degrees of the equator; 361 x 290 longitude/latitude; 45 vertical levels; top grid cell 0-6.19 m
- grid_label :
- gn
- initialization_index :
- 1
- institution :
- Canadian Centre for Climate Modelling and Analysis, Environment and Climate Change Canada, Victoria, BC V8P 5C2, Canada
- institution_id :
- CCCma
- license :
- CMIP6 model data produced by The Government of Canada (Canadian Centre for Climate Modelling and Analysis, Environment and Climate Change Canada) is licensed under a Creative Commons Attribution ShareAlike 4.0 International License (https://creativecommons.org/licenses). Consult https://pcmdi.llnl.gov/CMIP6/TermsOfUse for terms of use governing CMIP6 output, including citation requirements and proper acknowledgment. Further information about this data, including some limitations, can be found via the further_info_url (recorded as a global attribute in this file) and at https:///pcmdi.llnl.gov/. The data producers and data providers make no warranty, either express or implied, including, but not limited to, warranties of merchantability and fitness for a particular purpose. All liabilities arising from the supply of the information (including any liability arising in negligence) are excluded to the fullest extent permitted by law.
- mip_era :
- CMIP6
- nominal_resolution :
- 100 km
- parent_activity_id :
- CMIP
- parent_experiment_id :
- piControl
- parent_mip_era :
- CMIP6
- parent_source_id :
- CanESM5-CanOE
- parent_time_units :
- days since 1850-01-01 0:0:0.0
- parent_variant_label :
- r1i1p2f1
- physics_index :
- 2
- product :
- model-output
- realization_index :
- 2
- realm :
- ocean
- references :
- Geoscientific Model Development Special issue on CanESM5 (https://www.geosci-model-dev.net/special_issue989.html)
- source :
- CanESM5-CanOE (2019): aerosol: interactive atmos: CanAM5 (T63L49 native atmosphere, T63 Linear Gaussian Grid; 128 x 64 longitude/latitude; 49 levels; top level 1 hPa) atmosChem: specified oxidants for aerosols land: CLASS3.6/CTEM1.2 landIce: specified ice sheets ocean: NEMO3.4.1 (ORCA1 tripolar grid, 1 deg with refinement to 1/3 deg within 20 degrees of the equator; 361 x 290 longitude/latitude; 45 vertical levels; top grid cell 0-6.19 m) ocnBgchem: Canadian Ocean Ecosystem (CanOE) with OMIP prescribed carbon chemistry seaIce: LIM2
- source_id :
- CanESM5-CanOE
- source_type :
- AOGCM
- sub_experiment :
- none
- sub_experiment_id :
- none
- table_id :
- Omon
- table_info :
- Creation Date:(24 July 2019) MD5:c93735846d66458966fc81f390b2d714
- title :
- CanESM5-CanOE output prepared for CMIP6
- variant_label :
- r2i1p2f1
- version :
- v20190429
- version_id :
- v20190429
- intake_esm_varname :
- None
- original_key :
- CMIP.CCCma.CanESM5-CanOE.historical.r2i1p2f1.Omon.zos.gn.gs://cmip6/CMIP6/CMIP/CCCma/CanESM5-CanOE/historical/r2i1p2f1/Omon/zos/gn/v20190429/.nan.20190429
Cool, now we have a dictionary where each entry only contains one member. This approach can be used to implement a variety of custom functions on matched datasets.
Combining different grids via interpolation
Not all outputs in CMIP for a specific model are provided on the same grid structure. Especially in the ocean, the native grid gn can be quite complex and some variables are regridded to regular lon/lat grids for either convenience or to save storage.
[2]:
col = google_cmip_col()
cat = col.search(
variable_id=["thetao", "o2"],
experiment_id=["historical"],
source_id=["GFDL-ESM4", "CanESM5-CanOE"],
table_id=["Omon"],
)
ddict = cat.to_dataset_dict(
zarr_kwargs={"consolidated": True, "use_cftime": True},
aggregate=False,
preprocess=combined_preprocessing,
)
--> The keys in the returned dictionary of datasets are constructed as follows:
'activity_id.institution_id.source_id.experiment_id.member_id.table_id.variable_id.grid_label.zstore.dcpp_init_year.version'
[3]:
list(ddict.keys())
[3]:
['CMIP.CCCma.CanESM5-CanOE.historical.r3i1p2f1.Omon.thetao.gn.gs://cmip6/CMIP6/CMIP/CCCma/CanESM5-CanOE/historical/r3i1p2f1/Omon/thetao/gn/v20190429/.nan.20190429',
'CMIP.CCCma.CanESM5-CanOE.historical.r2i1p2f1.Omon.thetao.gn.gs://cmip6/CMIP6/CMIP/CCCma/CanESM5-CanOE/historical/r2i1p2f1/Omon/thetao/gn/v20190429/.nan.20190429',
'CMIP.CCCma.CanESM5-CanOE.historical.r3i1p2f1.Omon.o2.gn.gs://cmip6/CMIP6/CMIP/CCCma/CanESM5-CanOE/historical/r3i1p2f1/Omon/o2/gn/v20190429/.nan.20190429',
'CMIP.NOAA-GFDL.GFDL-ESM4.historical.r1i1p1f1.Omon.thetao.gr.gs://cmip6/CMIP6/CMIP/NOAA-GFDL/GFDL-ESM4/historical/r1i1p1f1/Omon/thetao/gr/v20190726/.nan.20190726',
'CMIP.NOAA-GFDL.GFDL-ESM4.historical.r1i1p1f1.Omon.thetao.gn.gs://cmip6/CMIP6/CMIP/NOAA-GFDL/GFDL-ESM4/historical/r1i1p1f1/Omon/thetao/gn/v20190726/.nan.20190726',
'CMIP.NOAA-GFDL.GFDL-ESM4.historical.r1i1p1f1.Omon.o2.gr.gs://cmip6/CMIP6/CMIP/NOAA-GFDL/GFDL-ESM4/historical/r1i1p1f1/Omon/o2/gr/v20190726/.nan.20190726',
'CMIP.CCCma.CanESM5-CanOE.historical.r2i1p2f1.Omon.o2.gn.gs://cmip6/CMIP6/CMIP/CCCma/CanESM5-CanOE/historical/r2i1p2f1/Omon/o2/gn/v20190429/.nan.20190429',
'CMIP.CCCma.CanESM5-CanOE.historical.r1i1p2f1.Omon.o2.gn.gs://cmip6/CMIP6/CMIP/CCCma/CanESM5-CanOE/historical/r1i1p2f1/Omon/o2/gn/v20190429/.nan.20190429',
'CMIP.CCCma.CanESM5-CanOE.historical.r1i1p2f1.Omon.thetao.gn.gs://cmip6/CMIP6/CMIP/CCCma/CanESM5-CanOE/historical/r1i1p2f1/Omon/thetao/gn/v20190429/.nan.20190429']
For the CanESM5-CanOE model, all variables are on the native gn grid. We could combine the variables simply using the logic from above. But the GFDL-ESM4 model provides oxygen o2 only on a regridded gr grid, while the potential temperature thetao is actually available for both grids. If we are fine with using the lower resolution regridded (gr) we could just filter for that during the selection, but there are cases where one might want to preserve as much detail as possible,
or where another variable is only available on the native grid. In that case we can use xESMF to interpolate from one grid to another.
xmip provides a convenient wrapper which will interpolate datasets onto the desired grid if necessary:
[5]:
from xmip.postprocessing import (
interpolate_grid_label
)
[11]:
combined_grids_dict = interpolate_grid_label(ddict, target_grid_label='gn')
/srv/conda/envs/notebook/lib/python3.8/site-packages/xesmf/frontend.py:496: FutureWarning: ``output_sizes`` should be given in the ``dask_gufunc_kwargs`` parameter. It will be removed as direct parameter in a future version.
ds_out = xr.apply_ufunc(
[8]:
list(combined_grids_dict.keys())
[8]:
['CanESM5-CanOE.historical.Omon.r3i1p2f1',
'CanESM5-CanOE.historical.Omon.r2i1p2f1',
'GFDL-ESM4.historical.Omon.r1i1p1f1',
'CanESM5-CanOE.historical.Omon.r1i1p2f1']
Ok we can see that apparently the variables have been combined for each model member. Lets take a closer look:
[9]:
combined_grids_dict['GFDL-ESM4.historical.Omon.r1i1p1f1']
[9]:
<xarray.Dataset>
Dimensions: (bnds: 3, lev: 35, time: 1980, vertex: 4, x: 720, y: 576)
Coordinates: (12/14)
* bnds (bnds) float64 0.0 1.0 2.0
* x (x) float64 -299.8 -299.2 -298.8 -298.2 ... 58.75 59.25 59.75
* y (y) float64 -77.91 -77.72 -77.54 -77.36 ... 89.47 89.68 89.89
lat (y, x) float32 dask.array<chunksize=(576, 720), meta=np.ndarray>
lat_verticies (y, x, vertex) float32 dask.array<chunksize=(576, 720, 4), meta=np.ndarray>
* lev (lev) float64 2.5 10.0 20.0 32.5 ... 5.5e+03 6e+03 6.5e+03
... ...
lon_verticies (y, x, vertex) float32 dask.array<chunksize=(576, 720, 4), meta=np.ndarray>
* time (time) object 1850-01-16 12:00:00 ... 2014-12-16 12:00:00
time_bounds (time, bnds) object dask.array<chunksize=(1980, 3), meta=np.ndarray>
* vertex (vertex) int64 0 1 2 3
lon_bounds (bnds, y, x) float32 dask.array<chunksize=(2, 576, 720), meta=np.ndarray>
lat_bounds (bnds, y, x) float32 dask.array<chunksize=(2, 576, 720), meta=np.ndarray>
Data variables:
thetao (time, lev, y, x) float32 dask.array<chunksize=(4, 35, 576, 720), meta=np.ndarray>
o2 (time, lev, y, x) float64 dask.array<chunksize=(13, 35, 576, 720), meta=np.ndarray>
Attributes: (12/41)
Conventions: CF-1.7 CMIP-6.0 UGRID-1.0
activity_id: CMIP
branch_method: standard
branch_time_in_child: 0.0
branch_time_in_parent: 36500.0
comment: <null ref>
... ...
title: NOAA GFDL GFDL-ESM4 model output prepared for CMI...
variant_info: N/A
variant_label: r1i1p1f1
version_id: v20190726
intake_esm_varname: None
regrid_method: bilinear- bnds: 3
- lev: 35
- time: 1980
- vertex: 4
- x: 720
- y: 576
- bnds(bnds)float640.0 1.0 2.0
- long_name :
- vertex number
array([0., 1., 2.])
- x(x)float64-299.8 -299.2 ... 59.25 59.75
- axis :
- X
- long_name :
- x coordinate of projection
- standard_name :
- projection_x_coordinate
- units :
- degrees
array([-299.75, -299.25, -298.75, ..., 58.75, 59.25, 59.75])
- y(y)float64-77.91 -77.72 ... 89.68 89.89
- axis :
- Y
- long_name :
- y coordinate of projection
- standard_name :
- projection_y_coordinate
- units :
- degrees
array([-77.907938, -77.723813, -77.539688, ..., 89.472 , 89.6832 , 89.8944 ]) - lat(y, x)float32dask.array<chunksize=(576, 720), meta=np.ndarray>
Array Chunk Bytes 1.58 MiB 1.58 MiB Shape (576, 720) (576, 720) Count 6 Tasks 1 Chunks Type float32 numpy.ndarray - lat_verticies(y, x, vertex)float32dask.array<chunksize=(576, 720, 4), meta=np.ndarray>
Array Chunk Bytes 6.33 MiB 6.33 MiB Shape (576, 720, 4) (576, 720, 4) Count 4 Tasks 1 Chunks Type float32 numpy.ndarray - lev(lev)float642.5 10.0 20.0 ... 6e+03 6.5e+03
- axis :
- Z
- bounds :
- lev_bnds
- description :
- generic ocean model vertical coordinate (nondimensional or dimensional)
- long_name :
- ocean model level
- positive :
- down
- units :
- m
array([2.5000e+00, 1.0000e+01, 2.0000e+01, 3.2500e+01, 5.1250e+01, 7.5000e+01, 1.0000e+02, 1.2500e+02, 1.5625e+02, 2.0000e+02, 2.5000e+02, 3.1250e+02, 4.0000e+02, 5.0000e+02, 6.0000e+02, 7.0000e+02, 8.0000e+02, 9.0000e+02, 1.0000e+03, 1.1000e+03, 1.2000e+03, 1.3000e+03, 1.4000e+03, 1.5375e+03, 1.7500e+03, 2.0625e+03, 2.5000e+03, 3.0000e+03, 3.5000e+03, 4.0000e+03, 4.5000e+03, 5.0000e+03, 5.5000e+03, 6.0000e+03, 6.5000e+03]) - lev_bounds(lev, bnds)float64dask.array<chunksize=(35, 3), meta=np.ndarray>
Array Chunk Bytes 840 B 840 B Shape (35, 3) (35, 3) Count 11 Tasks 1 Chunks Type float64 numpy.ndarray - lon(y, x)float32dask.array<chunksize=(576, 720), meta=np.ndarray>
Array Chunk Bytes 1.58 MiB 1.58 MiB Shape (576, 720) (576, 720) Count 9 Tasks 1 Chunks Type float32 numpy.ndarray - lon_verticies(y, x, vertex)float32dask.array<chunksize=(576, 720, 4), meta=np.ndarray>
Array Chunk Bytes 6.33 MiB 6.33 MiB Shape (576, 720, 4) (576, 720, 4) Count 7 Tasks 1 Chunks Type float32 numpy.ndarray - time(time)object1850-01-16 12:00:00 ... 2014-12-...
- axis :
- T
- bounds :
- time_bnds
- calendar_type :
- noleap
- description :
- Temporal mean
- long_name :
- time
- standard_name :
- time
array([cftime.DatetimeNoLeap(1850, 1, 16, 12, 0, 0, 0), cftime.DatetimeNoLeap(1850, 2, 15, 0, 0, 0, 0), cftime.DatetimeNoLeap(1850, 3, 16, 12, 0, 0, 0), ..., cftime.DatetimeNoLeap(2014, 10, 16, 12, 0, 0, 0), cftime.DatetimeNoLeap(2014, 11, 16, 0, 0, 0, 0), cftime.DatetimeNoLeap(2014, 12, 16, 12, 0, 0, 0)], dtype=object) - time_bounds(time, bnds)objectdask.array<chunksize=(1980, 3), meta=np.ndarray>
- long_name :
- time axis boundaries
Array Chunk Bytes 46.41 kiB 46.41 kiB Shape (1980, 3) (1980, 3) Count 11 Tasks 1 Chunks Type object numpy.ndarray - vertex(vertex)int640 1 2 3
array([0, 1, 2, 3])
- lon_bounds(bnds, y, x)float32dask.array<chunksize=(2, 576, 720), meta=np.ndarray>
Array Chunk Bytes 4.75 MiB 3.16 MiB Shape (3, 576, 720) (2, 576, 720) Count 35 Tasks 2 Chunks Type float32 numpy.ndarray - lat_bounds(bnds, y, x)float32dask.array<chunksize=(2, 576, 720), meta=np.ndarray>
Array Chunk Bytes 4.75 MiB 3.16 MiB Shape (3, 576, 720) (2, 576, 720) Count 32 Tasks 2 Chunks Type float32 numpy.ndarray
- thetao(time, lev, y, x)float32dask.array<chunksize=(4, 35, 576, 720), meta=np.ndarray>
- cell_measures :
- area: areacello volume: volcello
- cell_methods :
- area: mean where sea time: mean
- long_name :
- Sea Water Potential Temperature
- original_name :
- thetao
- standard_name :
- sea_water_potential_temperature
- units :
- degC
Array Chunk Bytes 107.07 GiB 221.48 MiB Shape (1980, 35, 576, 720) (4, 35, 576, 720) Count 496 Tasks 495 Chunks Type float32 numpy.ndarray - o2(time, lev, y, x)float64dask.array<chunksize=(13, 35, 576, 720), meta=np.ndarray>
- cell_measures :
- area: areacello volume: volcello
- cell_methods :
- area: mean where sea time: mean
- comment :
- Model data on the 1x1 grid includes values in all cells for which any ocean exists on the native grid. For mapping purposes, we recommend using a land mask such as World Ocean Atlas to cover these areas of partial land. For calculating approximate integrals, we recommend multiplying by cell volume (volcello).
- interp_method :
- conserve_order1
- long_name :
- Dissolved Oxygen Concentration
- original_name :
- o2
- standard_name :
- mole_concentration_of_dissolved_molecular_oxygen_in_sea_water
- units :
- mol m-3
- xmip_regrid_method :
- bilinear
Array Chunk Bytes 214.13 GiB 1.41 GiB Shape (1980, 35, 576, 720) (13, 35, 576, 720) Count 613 Tasks 153 Chunks Type float64 numpy.ndarray
- Conventions :
- CF-1.7 CMIP-6.0 UGRID-1.0
- activity_id :
- CMIP
- branch_method :
- standard
- branch_time_in_child :
- 0.0
- branch_time_in_parent :
- 36500.0
- comment :
- <null ref>
- contact :
- gfdl.climate.model.info@noaa.gov
- data_specs_version :
- 01.00.27
- experiment :
- all-forcing simulation of the recent past
- experiment_id :
- historical
- external_variables :
- areacello volcello
- forcing_index :
- 1
- frequency :
- mon
- further_info_url :
- https://furtherinfo.es-doc.org/CMIP6.NOAA-GFDL.GFDL-ESM4.historical.none.r1i1p1f1
- grid_label :
- gn
- initialization_index :
- 1
- institution :
- National Oceanic and Atmospheric Administration, Geophysical Fluid Dynamics Laboratory, Princeton, NJ 08540, USA
- institution_id :
- NOAA-GFDL
- license :
- CMIP6 model data produced by NOAA-GFDL is licensed under a Creative Commons Attribution-ShareAlike 4.0 International License (https://creativecommons.org/licenses/). Consult https://pcmdi.llnl.gov/CMIP6/TermsOfUse for terms of use governing CMIP6 output, including citation requirements and proper acknowledgment. Further information about this data, including some limitations, can be found via the further_info_url (recorded as a global attribute in this file). The data producers and data providers make no warranty, either express or implied, including, but not limited to, warranties of merchantability and fitness for a particular purpose. All liabilities arising from the supply of the information (including any liability arising in negligence) are excluded to the fullest extent permitted by law.
- mip_era :
- CMIP6
- parent_activity_id :
- CMIP
- parent_experiment_id :
- piControl
- parent_mip_era :
- CMIP6
- parent_source_id :
- GFDL-ESM4
- parent_time_units :
- days since 0001-1-1
- parent_variant_label :
- r1i1p1f1
- physics_index :
- 1
- product :
- model-output
- realization_index :
- 1
- references :
- see further_info_url attribute
- source_id :
- GFDL-ESM4
- source_type :
- AOGCM AER CHEM BGC
- sub_experiment :
- none
- sub_experiment_id :
- none
- table_id :
- Omon
- title :
- NOAA GFDL GFDL-ESM4 model output prepared for CMIP6 all-forcing simulation of the recent past
- variant_info :
- N/A
- variant_label :
- r1i1p1f1
- version_id :
- v20190726
- intake_esm_varname :
- None
- regrid_method :
- bilinear
Both data variables have the same shape, and we can confirm that these match the high resolution native grid ouput.
[10]:
ddict['CMIP.NOAA-GFDL.GFDL-ESM4.historical.r1i1p1f1.Omon.thetao.gn.gs://cmip6/CMIP6/CMIP/NOAA-GFDL/GFDL-ESM4/historical/r1i1p1f1/Omon/thetao/gn/v20190726/.nan.20190726']
[10]:
<xarray.Dataset>
Dimensions: (bnds: 2, lev: 35, time: 1980, vertex: 4, x: 720, y: 576)
Coordinates: (12/14)
* bnds (bnds) float64 1.0 2.0
lat (y, x) float32 dask.array<chunksize=(576, 720), meta=np.ndarray>
lat_verticies (y, x, vertex) float32 dask.array<chunksize=(576, 720, 4), meta=np.ndarray>
* lev (lev) float64 2.5 10.0 20.0 32.5 ... 5.5e+03 6e+03 6.5e+03
lev_bounds (lev, bnds) float64 dask.array<chunksize=(35, 2), meta=np.ndarray>
lon (y, x) float32 dask.array<chunksize=(576, 720), meta=np.ndarray>
... ...
time_bounds (time, bnds) object dask.array<chunksize=(1980, 2), meta=np.ndarray>
* x (x) float64 -299.8 -299.2 -298.8 -298.2 ... 58.75 59.25 59.75
* y (y) float64 -77.91 -77.72 -77.54 -77.36 ... 89.47 89.68 89.89
* vertex (vertex) int64 0 1 2 3
lon_bounds (bnds, y, x) float32 dask.array<chunksize=(1, 576, 720), meta=np.ndarray>
lat_bounds (bnds, y, x) float32 dask.array<chunksize=(1, 576, 720), meta=np.ndarray>
Data variables:
thetao (time, lev, y, x) float32 dask.array<chunksize=(4, 35, 576, 720), meta=np.ndarray>
Attributes: (12/52)
Conventions: CF-1.7 CMIP-6.0 UGRID-1.0
activity_id: CMIP
branch_method: standard
branch_time_in_child: 0.0
branch_time_in_parent: 36500.0
comment: <null ref>
... ...
status: 2019-10-25;created;by nhn2@columbia.edu
netcdf_tracking_ids: hdl:21.14100/6e88fbac-ee16-434e-88b4-92bd18c5300...
version_id: v20190726
intake_esm_varname: None
intake_esm_dataset_key: CMIP.NOAA-GFDL.GFDL-ESM4.historical.r1i1p1f1.Omo...
original_key: CMIP.NOAA-GFDL.GFDL-ESM4.historical.r1i1p1f1.Omo...- bnds: 2
- lev: 35
- time: 1980
- vertex: 4
- x: 720
- y: 576
- bnds(bnds)float641.0 2.0
- long_name :
- vertex number
array([1., 2.])
- lat(y, x)float32dask.array<chunksize=(576, 720), meta=np.ndarray>
Array Chunk Bytes 1.58 MiB 1.58 MiB Shape (576, 720) (576, 720) Count 6 Tasks 1 Chunks Type float32 numpy.ndarray - lat_verticies(y, x, vertex)float32dask.array<chunksize=(576, 720, 4), meta=np.ndarray>
Array Chunk Bytes 6.33 MiB 6.33 MiB Shape (576, 720, 4) (576, 720, 4) Count 4 Tasks 1 Chunks Type float32 numpy.ndarray - lev(lev)float642.5 10.0 20.0 ... 6e+03 6.5e+03
- axis :
- Z
- bounds :
- lev_bnds
- description :
- generic ocean model vertical coordinate (nondimensional or dimensional)
- long_name :
- ocean model level
- positive :
- down
- units :
- m
array([2.5000e+00, 1.0000e+01, 2.0000e+01, 3.2500e+01, 5.1250e+01, 7.5000e+01, 1.0000e+02, 1.2500e+02, 1.5625e+02, 2.0000e+02, 2.5000e+02, 3.1250e+02, 4.0000e+02, 5.0000e+02, 6.0000e+02, 7.0000e+02, 8.0000e+02, 9.0000e+02, 1.0000e+03, 1.1000e+03, 1.2000e+03, 1.3000e+03, 1.4000e+03, 1.5375e+03, 1.7500e+03, 2.0625e+03, 2.5000e+03, 3.0000e+03, 3.5000e+03, 4.0000e+03, 4.5000e+03, 5.0000e+03, 5.5000e+03, 6.0000e+03, 6.5000e+03]) - lev_bounds(lev, bnds)float64dask.array<chunksize=(35, 2), meta=np.ndarray>
Array Chunk Bytes 560 B 560 B Shape (35, 2) (35, 2) Count 3 Tasks 1 Chunks Type float64 numpy.ndarray - lon(y, x)float32dask.array<chunksize=(576, 720), meta=np.ndarray>
Array Chunk Bytes 1.58 MiB 1.58 MiB Shape (576, 720) (576, 720) Count 9 Tasks 1 Chunks Type float32 numpy.ndarray - lon_verticies(y, x, vertex)float32dask.array<chunksize=(576, 720, 4), meta=np.ndarray>
Array Chunk Bytes 6.33 MiB 6.33 MiB Shape (576, 720, 4) (576, 720, 4) Count 7 Tasks 1 Chunks Type float32 numpy.ndarray - time(time)object1850-01-16 12:00:00 ... 2014-12-...
- axis :
- T
- bounds :
- time_bnds
- calendar_type :
- noleap
- description :
- Temporal mean
- long_name :
- time
- standard_name :
- time
array([cftime.DatetimeNoLeap(1850, 1, 16, 12, 0, 0, 0), cftime.DatetimeNoLeap(1850, 2, 15, 0, 0, 0, 0), cftime.DatetimeNoLeap(1850, 3, 16, 12, 0, 0, 0), ..., cftime.DatetimeNoLeap(2014, 10, 16, 12, 0, 0, 0), cftime.DatetimeNoLeap(2014, 11, 16, 0, 0, 0, 0), cftime.DatetimeNoLeap(2014, 12, 16, 12, 0, 0, 0)], dtype=object) - time_bounds(time, bnds)objectdask.array<chunksize=(1980, 2), meta=np.ndarray>
- long_name :
- time axis boundaries
Array Chunk Bytes 30.94 kiB 30.94 kiB Shape (1980, 2) (1980, 2) Count 3 Tasks 1 Chunks Type object numpy.ndarray - x(x)float64-299.8 -299.2 ... 59.25 59.75
- axis :
- X
- long_name :
- x coordinate of projection
- standard_name :
- projection_x_coordinate
- units :
- degrees
array([-299.75, -299.25, -298.75, ..., 58.75, 59.25, 59.75])
- y(y)float64-77.91 -77.72 ... 89.68 89.89
- axis :
- Y
- long_name :
- y coordinate of projection
- standard_name :
- projection_y_coordinate
- units :
- degrees
array([-77.907938, -77.723813, -77.539688, ..., 89.472 , 89.6832 , 89.8944 ]) - vertex(vertex)int640 1 2 3
array([0, 1, 2, 3])
- lon_bounds(bnds, y, x)float32dask.array<chunksize=(1, 576, 720), meta=np.ndarray>
Array Chunk Bytes 3.16 MiB 1.58 MiB Shape (2, 576, 720) (1, 576, 720) Count 17 Tasks 2 Chunks Type float32 numpy.ndarray - lat_bounds(bnds, y, x)float32dask.array<chunksize=(1, 576, 720), meta=np.ndarray>
Array Chunk Bytes 3.16 MiB 1.58 MiB Shape (2, 576, 720) (1, 576, 720) Count 14 Tasks 2 Chunks Type float32 numpy.ndarray
- thetao(time, lev, y, x)float32dask.array<chunksize=(4, 35, 576, 720), meta=np.ndarray>
- cell_measures :
- area: areacello volume: volcello
- cell_methods :
- area: mean where sea time: mean
- long_name :
- Sea Water Potential Temperature
- original_name :
- thetao
- standard_name :
- sea_water_potential_temperature
- units :
- degC
Array Chunk Bytes 107.07 GiB 221.48 MiB Shape (1980, 35, 576, 720) (4, 35, 576, 720) Count 496 Tasks 495 Chunks Type float32 numpy.ndarray
- Conventions :
- CF-1.7 CMIP-6.0 UGRID-1.0
- activity_id :
- CMIP
- branch_method :
- standard
- branch_time_in_child :
- 0.0
- branch_time_in_parent :
- 36500.0
- comment :
- <null ref>
- contact :
- gfdl.climate.model.info@noaa.gov
- creation_date :
- 2019-08-06T13:49:47Z
- data_specs_version :
- 01.00.27
- experiment :
- all-forcing simulation of the recent past
- experiment_id :
- historical
- external_variables :
- areacello volcello
- forcing_index :
- 1
- frequency :
- mon
- further_info_url :
- https://furtherinfo.es-doc.org/CMIP6.NOAA-GFDL.GFDL-ESM4.historical.none.r1i1p1f1
- grid :
- ocean data on native grid tripolar - nominal 0.5 deg latitude/longitude
- grid_label :
- gn
- history :
- File was processed by fremetar (GFDL analog of CMOR). TripleID: [exper_id_MFLg3OOf97,realiz_id_6UiFuoEKMa,run_id_PhuSv75why]
- initialization_index :
- 1
- institution :
- National Oceanic and Atmospheric Administration, Geophysical Fluid Dynamics Laboratory, Princeton, NJ 08540, USA
- institution_id :
- NOAA-GFDL
- license :
- CMIP6 model data produced by NOAA-GFDL is licensed under a Creative Commons Attribution-ShareAlike 4.0 International License (https://creativecommons.org/licenses/). Consult https://pcmdi.llnl.gov/CMIP6/TermsOfUse for terms of use governing CMIP6 output, including citation requirements and proper acknowledgment. Further information about this data, including some limitations, can be found via the further_info_url (recorded as a global attribute in this file). The data producers and data providers make no warranty, either express or implied, including, but not limited to, warranties of merchantability and fitness for a particular purpose. All liabilities arising from the supply of the information (including any liability arising in negligence) are excluded to the fullest extent permitted by law.
- mip_era :
- CMIP6
- nominal_resolution :
- 50 km
- parent_activity_id :
- CMIP
- parent_experiment_id :
- piControl
- parent_mip_era :
- CMIP6
- parent_source_id :
- GFDL-ESM4
- parent_time_units :
- days since 0001-1-1
- parent_variant_label :
- r1i1p1f1
- physics_index :
- 1
- product :
- model-output
- realization_index :
- 1
- realm :
- ocean
- references :
- see further_info_url attribute
- source :
- GFDL-ESM4 (2018): atmos: GFDL-AM4.1 (Cubed-sphere (c96) - 1 degree nominal horizontal resolution; 360 x 180 longitude/latitude; 49 levels; top level 1 Pa) ocean: GFDL-OM4p5 (GFDL-MOM6, tripolar - nominal 0.5 deg; 720 x 576 longitude/latitude; 75 levels; top grid cell 0-2 m) seaIce: GFDL-SIM4p5 (GFDL-SIS2.0, tripolar - nominal 0.5 deg; 720 x 576 longitude/latitude; 5 layers; 5 thickness categories) land: GFDL-LM4.1 aerosol: interactive atmosChem: GFDL-ATMCHEM4.1 (full atmospheric chemistry) ocnBgchem: GFDL-COBALTv2 landIce: GFDL-LM4.1 (GFDL ID: 2019_0353)
- source_id :
- GFDL-ESM4
- source_type :
- AOGCM AER CHEM BGC
- sub_experiment :
- none
- sub_experiment_id :
- none
- table_id :
- Omon
- title :
- NOAA GFDL GFDL-ESM4 model output prepared for CMIP6 all-forcing simulation of the recent past
- tracking_id :
- hdl:21.14100/6e88fbac-ee16-434e-88b4-92bd18c5300f hdl:21.14100/5f509596-870f-458d-b3be-8b42463a337f hdl:21.14100/9217416d-c5b7-4d86-909a-30390911e7fb hdl:21.14100/0ee96a64-2f7c-4711-810e-03ac369de695 hdl:21.14100/42f58f72-ed23-4c4a-982c-7fa69368fba5 hdl:21.14100/1fd6b4ac-63d1-4f75-ae64-c5f08f7e0e07 hdl:21.14100/2b2bf817-fbc5-4ca3-8e7f-13c0e7c39e35 hdl:21.14100/aa06fff0-43a7-4375-b363-1646c99bccde hdl:21.14100/e8a05ba6-af9d-4f58-b909-b55612059e23
- variable_id :
- thetao
- variant_info :
- N/A
- variant_label :
- r1i1p1f1
- status :
- 2019-10-25;created;by nhn2@columbia.edu
- netcdf_tracking_ids :
- hdl:21.14100/6e88fbac-ee16-434e-88b4-92bd18c5300f hdl:21.14100/5f509596-870f-458d-b3be-8b42463a337f hdl:21.14100/9217416d-c5b7-4d86-909a-30390911e7fb hdl:21.14100/0ee96a64-2f7c-4711-810e-03ac369de695 hdl:21.14100/42f58f72-ed23-4c4a-982c-7fa69368fba5 hdl:21.14100/1fd6b4ac-63d1-4f75-ae64-c5f08f7e0e07 hdl:21.14100/2b2bf817-fbc5-4ca3-8e7f-13c0e7c39e35 hdl:21.14100/aa06fff0-43a7-4375-b363-1646c99bccde hdl:21.14100/e8a05ba6-af9d-4f58-b909-b55612059e23
- version_id :
- v20190726
- intake_esm_varname :
- None
- intake_esm_dataset_key :
- CMIP.NOAA-GFDL.GFDL-ESM4.historical.r1i1p1f1.Omon.thetao.gn.gs://cmip6/CMIP6/CMIP/NOAA-GFDL/GFDL-ESM4/historical/r1i1p1f1/Omon/thetao/gn/v20190726/.nan.20190726
- original_key :
- CMIP.NOAA-GFDL.GFDL-ESM4.historical.r1i1p1f1.Omon.thetao.gn.gs://cmip6/CMIP6/CMIP/NOAA-GFDL/GFDL-ESM4/historical/r1i1p1f1/Omon/thetao/gn/v20190726/.nan.20190726
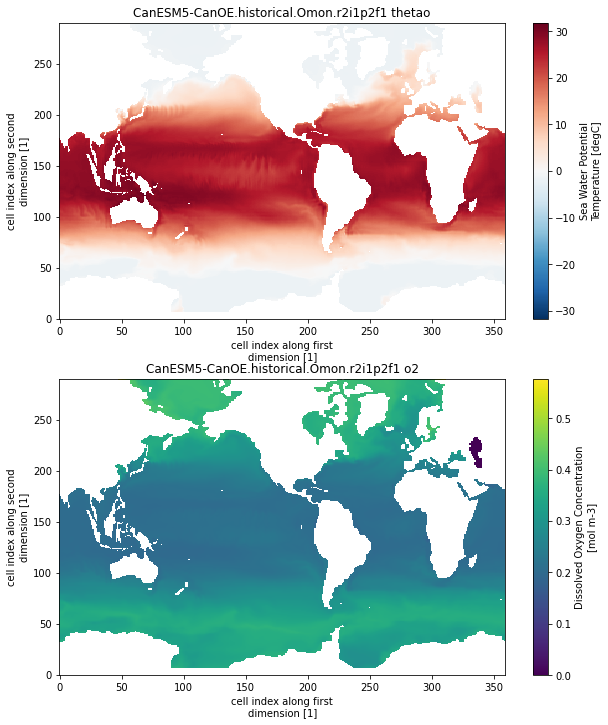
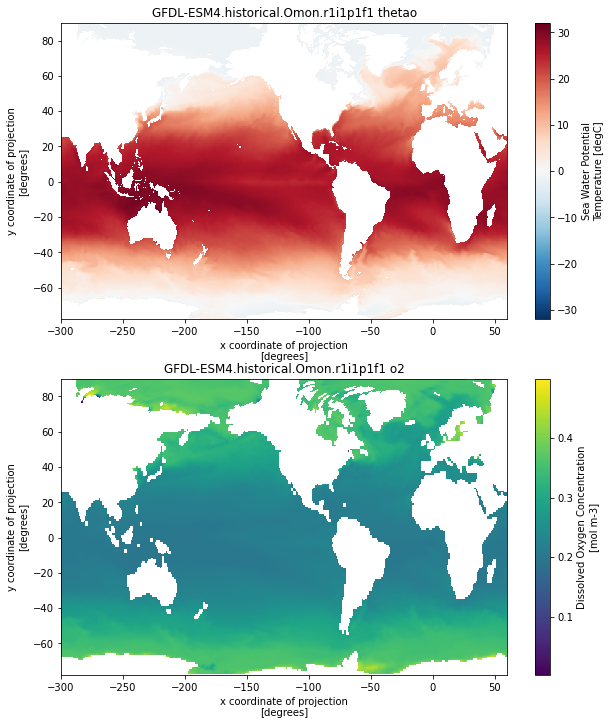
As a final check, lets plot some example maps:
[13]:
import matplotlib.pyplot as plt
for name, ds in combined_grids_dict.items():
ds = ds.isel(lev=0, time=0)
plt.figure(figsize=[10,12])
plt.subplot(2,1,1)
ds.thetao.plot()
plt.title(name+' thetao')
plt.subplot(2,1,2)
ds.o2.plot()
plt.title(name+' o2')
plt.show()
CanESM5-CanOE.historical.Omon.r3i1p2f1
[########################################] | 100% Completed | 0.9s
[########################################] | 100% Completed | 0.7s

CanESM5-CanOE.historical.Omon.r2i1p2f1
[########################################] | 100% Completed | 0.5s
[########################################] | 100% Completed | 0.8s
GFDL-ESM4.historical.Omon.r1i1p1f1
[########################################] | 100% Completed | 1.3s
[########################################] | 100% Completed | 4.9s
CanESM5-CanOE.historical.Omon.r1i1p2f1
[########################################] | 100% Completed | 0.7s
[########################################] | 100% Completed | 0.8s
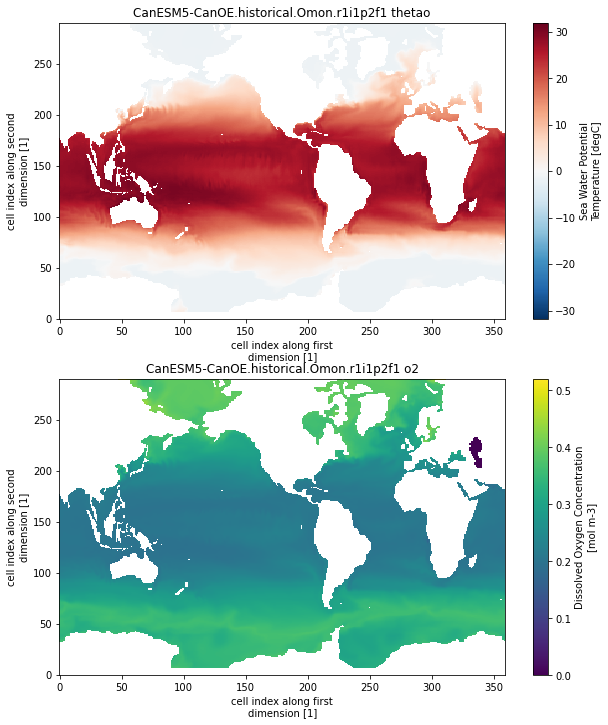
This looks pretty good! Some notes on the resulting data for further processing:
The regridding can be computationally expensive, especially for the higher res models. If you run into trouble, you might consider rechunking (along a non horizontal dimenson, e.g. depth or time)
As of now, we are using the xesmf defaults which can result in inconsistent positions of missing values between variables (check out the coastlines in the GFDL o2 vs thetao above). Make sure to take this into account if you are computing anything that incorporates values near the coastline or globally integrated quantities!
Handling grid metrics in CMIP6
Using the same logic as before we can start to match grid metrics to model output.
Almost any analysis with model data involves grid metrics like cell area, cell volume etc. These are essential to compute e.g. global averages since the cells in ocean models are usually not of equal size.
Within the CMIP6 archive grid metrics are stored as seperate variables like areacello (horizontal grid area) or thkcello(vertical cell thickness), and it can be rather cumbersome to match these. xmip has some functions to make this easy, which also offer some options to use metrics from e.g. another experiment in case these are not available (more on that below).
[1]:
import matplotlib.pyplot as plt
import numpy as np
plt.rcParams['figure.figsize'] = 12, 6
%config InlineBackend.figure_format = 'retina'
Lets start by loading a bunch of ocean temperature output into a dictionary of datasets
[7]:
from xmip.utils import google_cmip_col
from xmip.preprocessing import combined_preprocessing
col = google_cmip_col()
experiment_id='historical'
source_id = 'MPI-ESM1-2-LR'
kwargs = {'zarr_kwargs':{'consolidated':True, 'use_cftime':True}, 'aggregate':False, 'preprocess':combined_preprocessing}
cat_data = col.search(source_id=source_id, experiment_id=experiment_id, variable_id='tos')
ddict = cat_data.to_dataset_dict(**kwargs)
--> The keys in the returned dictionary of datasets are constructed as follows:
        'activity_id.institution_id.source_id.experiment_id.member_id.table_id.variable_id.grid_label.zstore.dcpp_init_year.version'
Note the
aggregate=Falseoption, which prevents the concatenation of model members in this case. I have found that in many cases this concatenation can lead to dask performance problems and I currently do not recommend it in my workflow.
Now lets repeat the step, but switch the variable_id to a metric of interest, like the cell area.
[8]:
cat_metric = col.search(source_id=source_id, experiment_id=experiment_id, variable_id='areacello')
ddict_metrics = cat_metric.to_dataset_dict(**kwargs)
--> The keys in the returned dictionary of datasets are constructed as follows:
        'activity_id.institution_id.source_id.experiment_id.member_id.table_id.variable_id.grid_label.zstore.dcpp_init_year.version'
You can see that there are 10 datasets loaded for both the metrics and the actual data. Lets match these up by using match_metrics
[9]:
from xmip.postprocessing import match_metrics
ddict_matched = match_metrics(ddict, ddict_metrics, ['areacello'])
You can convince yourself that all the datasets in ddict_matched now have a coordinate called areacello
[12]:
ddict_matched['CMIP.MPI-M.MPI-ESM1-2-LR.historical.r1i1p1f1.Oday.tos.gn.gs://cmip6/CMIP6/CMIP/MPI-M/MPI-ESM1-2-LR/historical/r1i1p1f1/Oday/tos/gn/v20190710/.nan.20190710']
[12]:
<xarray.Dataset>
Dimensions: (bnds: 2, time: 60265, vertex: 4, x: 256, y: 220)
Coordinates:
* x (x) int32 0 1 2 3 4 5 6 7 ... 248 249 250 251 252 253 254 255
* y (y) int32 0 1 2 3 4 5 6 7 ... 212 213 214 215 216 217 218 219
lat (y, x) float64 dask.array<chunksize=(220, 256), meta=np.ndarray>
lon (y, x) float64 dask.array<chunksize=(220, 256), meta=np.ndarray>
* time (time) object 1850-01-01 12:00:00 ... 2014-12-31 12:00:00
time_bounds (time, bnds) object dask.array<chunksize=(30133, 1), meta=np.ndarray>
lat_verticies (y, x, vertex) float64 dask.array<chunksize=(220, 256, 4), meta=np.ndarray>
lon_verticies (y, x, vertex) float64 dask.array<chunksize=(220, 256, 4), meta=np.ndarray>
* bnds (bnds) int64 0 1
* vertex (vertex) int64 0 1 2 3
lon_bounds (bnds, y, x) float64 dask.array<chunksize=(1, 220, 256), meta=np.ndarray>
lat_bounds (bnds, y, x) float64 dask.array<chunksize=(1, 220, 256), meta=np.ndarray>
areacello (y, x) float32 dask.array<chunksize=(220, 256), meta=np.ndarray>
Data variables:
tos (time, y, x) float32 dask.array<chunksize=(429, 220, 256), meta=np.ndarray>
Attributes:
Conventions: CF-1.7 CMIP-6.2
activity_id: CMIP
branch_method: standard
branch_time_in_child: 0.0
branch_time_in_parent: 0.0
cmor_version: 3.5.0
contact: cmip6-mpi-esm@dkrz.de
creation_date: 2019-09-11T14:21:40Z
data_specs_version: 01.00.30
experiment: all-forcing simulation of the recent past
experiment_id: historical
external_variables: areacello
forcing_index: 1
frequency: day
further_info_url: https://furtherinfo.es-doc.org/CMIP6.MPI-M.MPI-E...
grid: gn
grid_label: gn
history: 2019-09-11T14:21:40Z ; CMOR rewrote data to be c...
initialization_index: 1
institution: Max Planck Institute for Meteorology, Hamburg 20...
institution_id: MPI-M
license: CMIP6 model data produced by MPI-M is licensed u...
mip_era: CMIP6
nominal_resolution: 250 km
parent_activity_id: CMIP
parent_experiment_id: piControl
parent_mip_era: CMIP6
parent_source_id: MPI-ESM1-2-LR
parent_time_units: days since 1850-1-1 00:00:00
parent_variant_label: r1i1p1f1
physics_index: 1
product: model-output
project_id: CMIP6
realization_index: 1
realm: ocean
references: MPI-ESM: Mauritsen, T. et al. (2019), Developmen...
source: MPI-ESM1.2-LR (2017): \naerosol: none, prescribe...
source_id: MPI-ESM1-2-LR
source_type: AOGCM
status: 2020-09-15;created; by gcs.cmip6.ldeo@gmail.com
sub_experiment: none
sub_experiment_id: none
table_id: Oday
table_info: Creation Date:(09 May 2019) MD5:e6ef8ececc8f3386...
title: MPI-ESM1-2-LR output prepared for CMIP6
tracking_id: hdl:21.14100/634f31a7-9841-4bd4-8a87-fcd03ea56e4...
variable_id: tos
variant_label: r1i1p1f1
netcdf_tracking_ids: hdl:21.14100/634f31a7-9841-4bd4-8a87-fcd03ea56e4...
version_id: v20190710
intake_esm_varname: None
intake_esm_dataset_key: CMIP.MPI-M.MPI-ESM1-2-LR.historical.r1i1p1f1.Oda...- bnds: 2
- time: 60265
- vertex: 4
- x: 256
- y: 220
- x(x)int320 1 2 3 4 5 ... 251 252 253 254 255
- long_name :
- cell index along first dimension
- units :
- 1
array([ 0, 1, 2, ..., 253, 254, 255], dtype=int32)
- y(y)int320 1 2 3 4 5 ... 215 216 217 218 219
- long_name :
- cell index along second dimension
- units :
- 1
array([ 0, 1, 2, ..., 217, 218, 219], dtype=int32)
- lat(y, x)float64dask.array<chunksize=(220, 256), meta=np.ndarray>
- bounds :
- vertices_latitude
- long_name :
- latitude
- standard_name :
- latitude
- units :
- degrees_north
Array Chunk Bytes 450.56 kB 450.56 kB Shape (220, 256) (220, 256) Count 6 Tasks 1 Chunks Type float64 numpy.ndarray - lon(y, x)float64dask.array<chunksize=(220, 256), meta=np.ndarray>
- bounds :
- vertices_longitude
- long_name :
- longitude
- standard_name :
- longitude
- units :
- degrees_east
Array Chunk Bytes 450.56 kB 450.56 kB Shape (220, 256) (220, 256) Count 9 Tasks 1 Chunks Type float64 numpy.ndarray - time(time)object1850-01-01 12:00:00 ... 2014-12-...
- axis :
- T
- bounds :
- time_bnds
- long_name :
- time
- standard_name :
- time
array([cftime.DatetimeProlepticGregorian(1850, 1, 1, 12, 0, 0, 0), cftime.DatetimeProlepticGregorian(1850, 1, 2, 12, 0, 0, 0), cftime.DatetimeProlepticGregorian(1850, 1, 3, 12, 0, 0, 0), ..., cftime.DatetimeProlepticGregorian(2014, 12, 29, 12, 0, 0, 0), cftime.DatetimeProlepticGregorian(2014, 12, 30, 12, 0, 0, 0), cftime.DatetimeProlepticGregorian(2014, 12, 31, 12, 0, 0, 0)], dtype=object) - time_bounds(time, bnds)objectdask.array<chunksize=(30133, 1), meta=np.ndarray>
Array Chunk Bytes 964.24 kB 241.06 kB Shape (60265, 2) (30133, 1) Count 5 Tasks 4 Chunks Type object numpy.ndarray - lat_verticies(y, x, vertex)float64dask.array<chunksize=(220, 256, 4), meta=np.ndarray>
- units :
- degrees_north
Array Chunk Bytes 1.80 MB 1.80 MB Shape (220, 256, 4) (220, 256, 4) Count 4 Tasks 1 Chunks Type float64 numpy.ndarray - lon_verticies(y, x, vertex)float64dask.array<chunksize=(220, 256, 4), meta=np.ndarray>
- units :
- degrees_east
Array Chunk Bytes 1.80 MB 1.80 MB Shape (220, 256, 4) (220, 256, 4) Count 7 Tasks 1 Chunks Type float64 numpy.ndarray - bnds(bnds)int640 1
array([0, 1])
- vertex(vertex)int640 1 2 3
array([0, 1, 2, 3])
- lon_bounds(bnds, y, x)float64dask.array<chunksize=(1, 220, 256), meta=np.ndarray>
Array Chunk Bytes 901.12 kB 450.56 kB Shape (2, 220, 256) (1, 220, 256) Count 17 Tasks 2 Chunks Type float64 numpy.ndarray - lat_bounds(bnds, y, x)float64dask.array<chunksize=(1, 220, 256), meta=np.ndarray>
Array Chunk Bytes 901.12 kB 450.56 kB Shape (2, 220, 256) (1, 220, 256) Count 14 Tasks 2 Chunks Type float64 numpy.ndarray - areacello(y, x)float32dask.array<chunksize=(220, 256), meta=np.ndarray>
- cell_methods :
- area: sum
- comment :
- Horizontal area of ocean grid cells
- history :
- 2019-09-11T14:21:40Z altered by CMOR: replaced missing value flag (-9e+33) and corresponding data with standard missing value (1e+20).
- long_name :
- Grid-Cell Area for Ocean Variables
- original_name :
- areacello
- standard_name :
- cell_area
- units :
- m2
- original_key :
- CMIP.MPI-M.MPI-ESM1-2-LR.historical.r1i1p1f1.Ofx.areacello.gn.gs://cmip6/CMIP6/CMIP/MPI-M/MPI-ESM1-2-LR/historical/r1i1p1f1/Ofx/areacello/gn/v20190710/.nan.20190710
- parsed_with :
- xmip/postprocessing/parse_metric
Array Chunk Bytes 225.28 kB 225.28 kB Shape (220, 256) (220, 256) Count 3 Tasks 1 Chunks Type float32 numpy.ndarray
- tos(time, y, x)float32dask.array<chunksize=(429, 220, 256), meta=np.ndarray>
- cell_measures :
- area: areacello
- cell_methods :
- area: mean where sea time: mean
- comment :
- Temperature of upper boundary of the liquid ocean, including temperatures below sea-ice and floating ice shelves.
- history :
- 2019-09-11T14:21:40Z altered by CMOR: replaced missing value flag (-9e+33) and corresponding data with standard missing value (1e+20).
- long_name :
- Sea Surface Temperature
- original_name :
- tos
- standard_name :
- sea_surface_temperature
- units :
- degC
Array Chunk Bytes 13.58 GB 96.65 MB Shape (60265, 220, 256) (429, 220, 256) Count 142 Tasks 141 Chunks Type float32 numpy.ndarray
- Conventions :
- CF-1.7 CMIP-6.2
- activity_id :
- CMIP
- branch_method :
- standard
- branch_time_in_child :
- 0.0
- branch_time_in_parent :
- 0.0
- cmor_version :
- 3.5.0
- contact :
- cmip6-mpi-esm@dkrz.de
- creation_date :
- 2019-09-11T14:21:40Z
- data_specs_version :
- 01.00.30
- experiment :
- all-forcing simulation of the recent past
- experiment_id :
- historical
- external_variables :
- areacello
- forcing_index :
- 1
- frequency :
- day
- further_info_url :
- https://furtherinfo.es-doc.org/CMIP6.MPI-M.MPI-ESM1-2-LR.historical.none.r1i1p1f1
- grid :
- gn
- grid_label :
- gn
- history :
- 2019-09-11T14:21:40Z ; CMOR rewrote data to be consistent with CMIP6, CF-1.7 CMIP-6.2 and CF standards.
- initialization_index :
- 1
- institution :
- Max Planck Institute for Meteorology, Hamburg 20146, Germany
- institution_id :
- MPI-M
- license :
- CMIP6 model data produced by MPI-M is licensed under a Creative Commons Attribution ShareAlike 4.0 International License (https://creativecommons.org/licenses). Consult https://pcmdi.llnl.gov/CMIP6/TermsOfUse for terms of use governing CMIP6 output, including citation requirements and proper acknowledgment. Further information about this data, including some limitations, can be found via the further_info_url (recorded as a global attribute in this file) and. The data producers and data providers make no warranty, either express or implied, including, but not limited to, warranties of merchantability and fitness for a particular purpose. All liabilities arising from the supply of the information (including any liability arising in negligence) are excluded to the fullest extent permitted by law.
- mip_era :
- CMIP6
- nominal_resolution :
- 250 km
- parent_activity_id :
- CMIP
- parent_experiment_id :
- piControl
- parent_mip_era :
- CMIP6
- parent_source_id :
- MPI-ESM1-2-LR
- parent_time_units :
- days since 1850-1-1 00:00:00
- parent_variant_label :
- r1i1p1f1
- physics_index :
- 1
- product :
- model-output
- project_id :
- CMIP6
- realization_index :
- 1
- realm :
- ocean
- references :
- MPI-ESM: Mauritsen, T. et al. (2019), Developments in the MPI‐M Earth System Model version 1.2 (MPI‐ESM1.2) and Its Response to Increasing CO2, J. Adv. Model. Earth Syst.,11, 998-1038, doi:10.1029/2018MS001400, Mueller, W.A. et al. (2018): A high‐resolution version of the Max Planck Institute Earth System Model MPI‐ESM1.2‐HR. J. Adv. Model. EarthSyst.,10,1383–1413, doi:10.1029/2017MS001217
- source :
- MPI-ESM1.2-LR (2017): aerosol: none, prescribed MACv2-SP atmos: ECHAM6.3 (spectral T63; 192 x 96 longitude/latitude; 47 levels; top level 0.01 hPa) atmosChem: none land: JSBACH3.20 landIce: none/prescribed ocean: MPIOM1.63 (bipolar GR1.5, approximately 1.5deg; 256 x 220 longitude/latitude; 40 levels; top grid cell 0-12 m) ocnBgchem: HAMOCC6 seaIce: unnamed (thermodynamic (Semtner zero-layer) dynamic (Hibler 79) sea ice model)
- source_id :
- MPI-ESM1-2-LR
- source_type :
- AOGCM
- status :
- 2020-09-15;created; by gcs.cmip6.ldeo@gmail.com
- sub_experiment :
- none
- sub_experiment_id :
- none
- table_id :
- Oday
- table_info :
- Creation Date:(09 May 2019) MD5:e6ef8ececc8f338646ebfb3aeed36bfc
- title :
- MPI-ESM1-2-LR output prepared for CMIP6
- tracking_id :
- hdl:21.14100/634f31a7-9841-4bd4-8a87-fcd03ea56e43 hdl:21.14100/44c392fa-ae43-48e6-b34d-5d76e983caca hdl:21.14100/b4696e47-b962-4b34-b18b-a08e81233dfb hdl:21.14100/906d6b65-44d4-4a7e-b32a-35156a0688db hdl:21.14100/930f144e-ebc1-4d40-ae37-50f11558fbcf hdl:21.14100/ed7c6286-81c9-40f6-bf4c-3be099b3984c hdl:21.14100/912277d8-c866-4f1d-a0cf-793f3022a3b0 hdl:21.14100/65506b1f-7953-4d4d-8c3d-5329bfd2db60 hdl:21.14100/cebbb65e-c082-4ed3-9bd7-5593f434b377
- variable_id :
- tos
- variant_label :
- r1i1p1f1
- netcdf_tracking_ids :
- hdl:21.14100/634f31a7-9841-4bd4-8a87-fcd03ea56e43 hdl:21.14100/44c392fa-ae43-48e6-b34d-5d76e983caca hdl:21.14100/b4696e47-b962-4b34-b18b-a08e81233dfb hdl:21.14100/906d6b65-44d4-4a7e-b32a-35156a0688db hdl:21.14100/930f144e-ebc1-4d40-ae37-50f11558fbcf hdl:21.14100/ed7c6286-81c9-40f6-bf4c-3be099b3984c hdl:21.14100/912277d8-c866-4f1d-a0cf-793f3022a3b0 hdl:21.14100/65506b1f-7953-4d4d-8c3d-5329bfd2db60 hdl:21.14100/cebbb65e-c082-4ed3-9bd7-5593f434b377
- version_id :
- v20190710
- intake_esm_varname :
- None
- intake_esm_dataset_key :
- CMIP.MPI-M.MPI-ESM1-2-LR.historical.r1i1p1f1.Oday.tos.gn.gs://cmip6/CMIP6/CMIP/MPI-M/MPI-ESM1-2-LR/historical/r1i1p1f1/Oday/tos/gn/v20190710/.nan.20190710
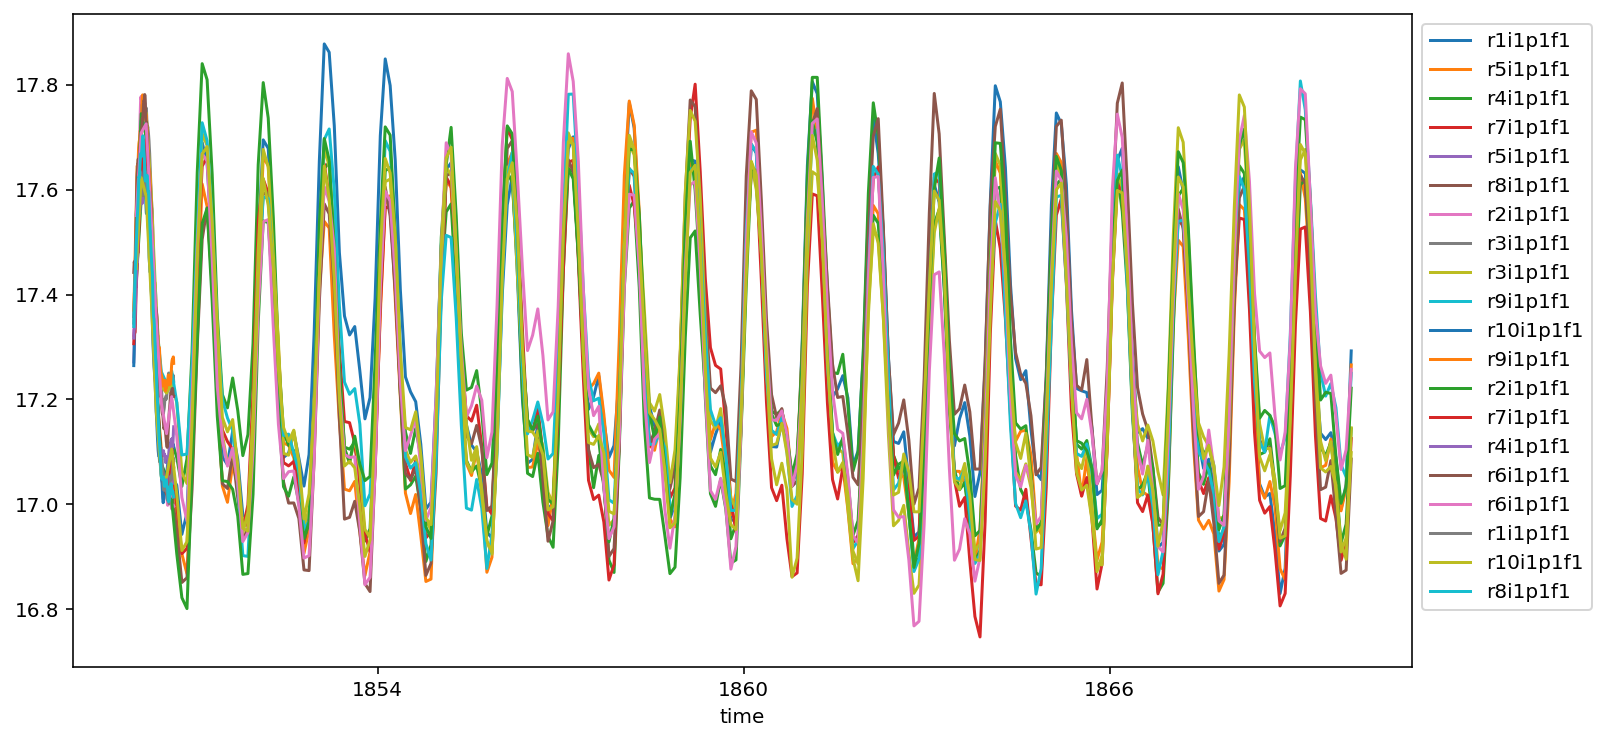
So lets put this to use. We can do a plot of properly weighted global sea surface temperature in a few lines now.
[15]:
fig, ax = plt.subplots()
for ds in ddict_matched.values():
# calculate the weighted average over the surface level temperatures
area = ds.areacello.fillna(0)
da = ds.tos.isel(time=slice(0,240)).weighted(area).mean(['x','y']).squeeze().load()
da.plot(ax=ax, label=ds.attrs['variant_label'])
ax.legend(bbox_to_anchor=(1, 1), loc='upper left')
[15]:
<matplotlib.legend.Legend at 0x1701643d0>
Match multiple metrics
That was not too bad. Lets continue with an example that needs multiple metrics. For this we will load the full depth potential temperature data (thetao), the cell area (areacello) and the vertical cell thickness (thkcello).
[18]:
cat_data = col.search(source_id=source_id, experiment_id=experiment_id, variable_id='thetao')
ddict = cat_data.to_dataset_dict(**kwargs)
cat_metric = col.search(source_id=source_id, variable_id=['areacello', 'thkcello'], experiment_id='historical')
ddict_metrics = cat_metric.to_dataset_dict(**kwargs)
# Matching
--> The keys in the returned dictionary of datasets are constructed as follows:
        'activity_id.institution_id.source_id.experiment_id.member_id.table_id.variable_id.grid_label.zstore.dcpp_init_year.version'
--> The keys in the returned dictionary of datasets are constructed as follows:
        'activity_id.institution_id.source_id.experiment_id.member_id.table_id.variable_id.grid_label.zstore.dcpp_init_year.version'
Matching both metrics can be done easily
[19]:
ddict_matched_again = match_metrics(ddict, ddict_metrics, ['areacello', 'thkcello'])
ddict_matched_again['CMIP.MPI-M.MPI-ESM1-2-LR.historical.r2i1p1f1.Omon.thetao.gn.gs://cmip6/CMIP6/CMIP/MPI-M/MPI-ESM1-2-LR/historical/r2i1p1f1/Omon/thetao/gn/v20190710/.nan.20190710']
[19]:
<xarray.Dataset>
Dimensions: (bnds: 2, lev: 40, time: 1980, vertex: 4, x: 256, y: 220)
Coordinates:
* x (x) int32 0 1 2 3 4 5 6 7 ... 248 249 250 251 252 253 254 255
* y (y) int32 0 1 2 3 4 5 6 7 ... 212 213 214 215 216 217 218 219
lat (y, x) float64 dask.array<chunksize=(220, 256), meta=np.ndarray>
* lev (lev) float64 6.0 17.0 27.0 ... 4.67e+03 5.17e+03 5.72e+03
lev_bounds (lev, bnds) float64 dask.array<chunksize=(40, 2), meta=np.ndarray>
lon (y, x) float64 dask.array<chunksize=(220, 256), meta=np.ndarray>
* time (time) object 1850-01-16 12:00:00 ... 2014-12-16 12:00:00
time_bounds (time, bnds) object dask.array<chunksize=(1980, 2), meta=np.ndarray>
lat_verticies (y, x, vertex) float64 dask.array<chunksize=(220, 256, 4), meta=np.ndarray>
lon_verticies (y, x, vertex) float64 dask.array<chunksize=(220, 256, 4), meta=np.ndarray>
* bnds (bnds) int64 0 1
* vertex (vertex) int64 0 1 2 3
lon_bounds (bnds, y, x) float64 dask.array<chunksize=(1, 220, 256), meta=np.ndarray>
lat_bounds (bnds, y, x) float64 dask.array<chunksize=(1, 220, 256), meta=np.ndarray>
areacello (y, x) float32 dask.array<chunksize=(220, 256), meta=np.ndarray>
thkcello (time, lev, y, x) float32 dask.array<chunksize=(66, 40, 220, 256), meta=np.ndarray>
Data variables:
thetao (time, lev, y, x) float32 dask.array<chunksize=(13, 40, 220, 256), meta=np.ndarray>
Attributes:
Conventions: CF-1.7 CMIP-6.2
activity_id: CMIP
branch_method: standard
branch_time_in_child: 0.0
branch_time_in_parent: 18262.0
cmor_version: 3.5.0
contact: cmip6-mpi-esm@dkrz.de
creation_date: 2019-09-02T13:08:50Z
data_specs_version: 01.00.30
experiment: all-forcing simulation of the recent past
experiment_id: historical
external_variables: areacello volcello
forcing_index: 1
frequency: mon
further_info_url: https://furtherinfo.es-doc.org/CMIP6.MPI-M.MPI-E...
grid: gn
grid_label: gn
history: 2019-09-02T13:08:50Z ; CMOR rewrote data to be c...
initialization_index: 1
institution: Max Planck Institute for Meteorology, Hamburg 20...
institution_id: MPI-M
license: CMIP6 model data produced by MPI-M is licensed u...
mip_era: CMIP6
nominal_resolution: 250 km
parent_activity_id: CMIP
parent_experiment_id: piControl
parent_mip_era: CMIP6
parent_source_id: MPI-ESM1-2-LR
parent_time_units: days since 1850-1-1 00:00:00
parent_variant_label: r1i1p1f1
physics_index: 1
product: model-output
project_id: CMIP6
realization_index: 2
realm: ocean
references: MPI-ESM: Mauritsen, T. et al. (2019), Developmen...
source: MPI-ESM1.2-LR (2017): \naerosol: none, prescribe...
source_id: MPI-ESM1-2-LR
source_type: AOGCM
status: 2020-07-12;created; by gcs.cmip6.ldeo@gmail.com
sub_experiment: none
sub_experiment_id: none
table_id: Omon
table_info: Creation Date:(09 May 2019) MD5:e6ef8ececc8f3386...
title: MPI-ESM1-2-LR output prepared for CMIP6
tracking_id: hdl:21.14100/9a791e46-3b24-49f0-a628-66ef71241d7...
variable_id: thetao
variant_label: r2i1p1f1
netcdf_tracking_ids: hdl:21.14100/9a791e46-3b24-49f0-a628-66ef71241d7...
version_id: v20190710
intake_esm_varname: None
intake_esm_dataset_key: CMIP.MPI-M.MPI-ESM1-2-LR.historical.r2i1p1f1.Omo...- bnds: 2
- lev: 40
- time: 1980
- vertex: 4
- x: 256
- y: 220
- x(x)int320 1 2 3 4 5 ... 251 252 253 254 255
- long_name :
- cell index along first dimension
- units :
- 1
array([ 0, 1, 2, ..., 253, 254, 255], dtype=int32)
- y(y)int320 1 2 3 4 5 ... 215 216 217 218 219
- long_name :
- cell index along second dimension
- units :
- 1
array([ 0, 1, 2, ..., 217, 218, 219], dtype=int32)
- lat(y, x)float64dask.array<chunksize=(220, 256), meta=np.ndarray>
- bounds :
- vertices_latitude
- long_name :
- latitude
- standard_name :
- latitude
- units :
- degrees_north
Array Chunk Bytes 450.56 kB 450.56 kB Shape (220, 256) (220, 256) Count 6 Tasks 1 Chunks Type float64 numpy.ndarray - lev(lev)float646.0 17.0 27.0 ... 5.17e+03 5.72e+03
- axis :
- Z
- bounds :
- lev_bnds
- long_name :
- ocean depth coordinate
- positive :
- down
- standard_name :
- depth
- units :
- m
array([ 6. , 17. , 27. , 37. , 47. , 57. , 68.5, 82.5, 100. , 122.5, 150. , 182.5, 220. , 262.5, 310. , 362.5, 420. , 485. , 560. , 645. , 740. , 845. , 960. , 1085. , 1220. , 1365. , 1525. , 1700. , 1885. , 2080. , 2290. , 2525. , 2785. , 3070. , 3395. , 3770. , 4195. , 4670. , 5170. , 5720. ]) - lev_bounds(lev, bnds)float64dask.array<chunksize=(40, 2), meta=np.ndarray>
Array Chunk Bytes 640 B 640 B Shape (40, 2) (40, 2) Count 3 Tasks 1 Chunks Type float64 numpy.ndarray - lon(y, x)float64dask.array<chunksize=(220, 256), meta=np.ndarray>
- bounds :
- vertices_longitude
- long_name :
- longitude
- standard_name :
- longitude
- units :
- degrees_east
Array Chunk Bytes 450.56 kB 450.56 kB Shape (220, 256) (220, 256) Count 9 Tasks 1 Chunks Type float64 numpy.ndarray - time(time)object1850-01-16 12:00:00 ... 2014-12-...
- axis :
- T
- bounds :
- time_bnds
- long_name :
- time
- standard_name :
- time
array([cftime.DatetimeProlepticGregorian(1850, 1, 16, 12, 0, 0, 0), cftime.DatetimeProlepticGregorian(1850, 2, 15, 0, 0, 0, 0), cftime.DatetimeProlepticGregorian(1850, 3, 16, 12, 0, 0, 0), ..., cftime.DatetimeProlepticGregorian(2014, 10, 16, 12, 0, 0, 0), cftime.DatetimeProlepticGregorian(2014, 11, 16, 0, 0, 0, 0), cftime.DatetimeProlepticGregorian(2014, 12, 16, 12, 0, 0, 0)], dtype=object) - time_bounds(time, bnds)objectdask.array<chunksize=(1980, 2), meta=np.ndarray>
Array Chunk Bytes 31.68 kB 31.68 kB Shape (1980, 2) (1980, 2) Count 3 Tasks 1 Chunks Type object numpy.ndarray - lat_verticies(y, x, vertex)float64dask.array<chunksize=(220, 256, 4), meta=np.ndarray>
- units :
- degrees_north
Array Chunk Bytes 1.80 MB 1.80 MB Shape (220, 256, 4) (220, 256, 4) Count 4 Tasks 1 Chunks Type float64 numpy.ndarray - lon_verticies(y, x, vertex)float64dask.array<chunksize=(220, 256, 4), meta=np.ndarray>
- units :
- degrees_east
Array Chunk Bytes 1.80 MB 1.80 MB Shape (220, 256, 4) (220, 256, 4) Count 7 Tasks 1 Chunks Type float64 numpy.ndarray - bnds(bnds)int640 1
array([0, 1])
- vertex(vertex)int640 1 2 3
array([0, 1, 2, 3])
- lon_bounds(bnds, y, x)float64dask.array<chunksize=(1, 220, 256), meta=np.ndarray>
Array Chunk Bytes 901.12 kB 450.56 kB Shape (2, 220, 256) (1, 220, 256) Count 17 Tasks 2 Chunks Type float64 numpy.ndarray - lat_bounds(bnds, y, x)float64dask.array<chunksize=(1, 220, 256), meta=np.ndarray>
Array Chunk Bytes 901.12 kB 450.56 kB Shape (2, 220, 256) (1, 220, 256) Count 14 Tasks 2 Chunks Type float64 numpy.ndarray - areacello(y, x)float32dask.array<chunksize=(220, 256), meta=np.ndarray>
- cell_methods :
- area: sum
- comment :
- Horizontal area of ocean grid cells
- history :
- 2019-09-02T13:08:47Z altered by CMOR: replaced missing value flag (-9e+33) and corresponding data with standard missing value (1e+20).
- long_name :
- Grid-Cell Area for Ocean Variables
- original_name :
- areacello
- standard_name :
- cell_area
- units :
- m2
- original_key :
- CMIP.MPI-M.MPI-ESM1-2-LR.historical.r2i1p1f1.Ofx.areacello.gn.gs://cmip6/CMIP6/CMIP/MPI-M/MPI-ESM1-2-LR/historical/r2i1p1f1/Ofx/areacello/gn/v20190710/.nan.20190710
- parsed_with :
- xmip/postprocessing/parse_metric
Array Chunk Bytes 225.28 kB 225.28 kB Shape (220, 256) (220, 256) Count 3 Tasks 1 Chunks Type float32 numpy.ndarray - thkcello(time, lev, y, x)float32dask.array<chunksize=(66, 40, 220, 256), meta=np.ndarray>
- cell_measures :
- area: areacello volume: volcello
- cell_methods :
- area: mean where sea time: mean
- comment :
- 'Thickness' means the vertical extent of a layer. 'Cell' refers to a model grid-cell.
- history :
- 2019-09-02T13:08:49Z altered by CMOR: replaced missing value flag (-9e+33) and corresponding data with standard missing value (1e+20).
- long_name :
- Ocean Model Cell Thickness
- original_name :
- thkcello
- standard_name :
- cell_thickness
- units :
- m
- original_key :
- CMIP.MPI-M.MPI-ESM1-2-LR.historical.r2i1p1f1.Omon.thkcello.gn.gs://cmip6/CMIP6/CMIP/MPI-M/MPI-ESM1-2-LR/historical/r2i1p1f1/Omon/thkcello/gn/v20190710/.nan.20190710
- parsed_with :
- xmip/postprocessing/parse_metric
Array Chunk Bytes 17.84 GB 594.74 MB Shape (1980, 40, 220, 256) (66, 40, 220, 256) Count 31 Tasks 30 Chunks Type float32 numpy.ndarray
- thetao(time, lev, y, x)float32dask.array<chunksize=(13, 40, 220, 256), meta=np.ndarray>
- cell_measures :
- area: areacello volume: volcello
- cell_methods :
- area: mean where sea time: mean
- comment :
- Diagnostic should be contributed even for models using conservative temperature as prognostic field.
- history :
- 2019-09-02T13:08:47Z altered by CMOR: replaced missing value flag (-9e+33) and corresponding data with standard missing value (1e+20).
- long_name :
- Sea Water Potential Temperature
- original_name :
- thetao
- standard_name :
- sea_water_potential_temperature
- units :
- degC
Array Chunk Bytes 17.84 GB 117.15 MB Shape (1980, 40, 220, 256) (13, 40, 220, 256) Count 154 Tasks 153 Chunks Type float32 numpy.ndarray
- Conventions :
- CF-1.7 CMIP-6.2
- activity_id :
- CMIP
- branch_method :
- standard
- branch_time_in_child :
- 0.0
- branch_time_in_parent :
- 18262.0
- cmor_version :
- 3.5.0
- contact :
- cmip6-mpi-esm@dkrz.de
- creation_date :
- 2019-09-02T13:08:50Z
- data_specs_version :
- 01.00.30
- experiment :
- all-forcing simulation of the recent past
- experiment_id :
- historical
- external_variables :
- areacello volcello
- forcing_index :
- 1
- frequency :
- mon
- further_info_url :
- https://furtherinfo.es-doc.org/CMIP6.MPI-M.MPI-ESM1-2-LR.historical.none.r2i1p1f1
- grid :
- gn
- grid_label :
- gn
- history :
- 2019-09-02T13:08:50Z ; CMOR rewrote data to be consistent with CMIP6, CF-1.7 CMIP-6.2 and CF standards.
- initialization_index :
- 1
- institution :
- Max Planck Institute for Meteorology, Hamburg 20146, Germany
- institution_id :
- MPI-M
- license :
- CMIP6 model data produced by MPI-M is licensed under a Creative Commons Attribution ShareAlike 4.0 International License (https://creativecommons.org/licenses). Consult https://pcmdi.llnl.gov/CMIP6/TermsOfUse for terms of use governing CMIP6 output, including citation requirements and proper acknowledgment. Further information about this data, including some limitations, can be found via the further_info_url (recorded as a global attribute in this file) and. The data producers and data providers make no warranty, either express or implied, including, but not limited to, warranties of merchantability and fitness for a particular purpose. All liabilities arising from the supply of the information (including any liability arising in negligence) are excluded to the fullest extent permitted by law.
- mip_era :
- CMIP6
- nominal_resolution :
- 250 km
- parent_activity_id :
- CMIP
- parent_experiment_id :
- piControl
- parent_mip_era :
- CMIP6
- parent_source_id :
- MPI-ESM1-2-LR
- parent_time_units :
- days since 1850-1-1 00:00:00
- parent_variant_label :
- r1i1p1f1
- physics_index :
- 1
- product :
- model-output
- project_id :
- CMIP6
- realization_index :
- 2
- realm :
- ocean
- references :
- MPI-ESM: Mauritsen, T. et al. (2019), Developments in the MPI‐M Earth System Model version 1.2 (MPI‐ESM1.2) and Its Response to Increasing CO2, J. Adv. Model. Earth Syst.,11, 998-1038, doi:10.1029/2018MS001400, Mueller, W.A. et al. (2018): A high‐resolution version of the Max Planck Institute Earth System Model MPI‐ESM1.2‐HR. J. Adv. Model. EarthSyst.,10,1383–1413, doi:10.1029/2017MS001217
- source :
- MPI-ESM1.2-LR (2017): aerosol: none, prescribed MACv2-SP atmos: ECHAM6.3 (spectral T63; 192 x 96 longitude/latitude; 47 levels; top level 0.01 hPa) atmosChem: none land: JSBACH3.20 landIce: none/prescribed ocean: MPIOM1.63 (bipolar GR1.5, approximately 1.5deg; 256 x 220 longitude/latitude; 40 levels; top grid cell 0-12 m) ocnBgchem: HAMOCC6 seaIce: unnamed (thermodynamic (Semtner zero-layer) dynamic (Hibler 79) sea ice model)
- source_id :
- MPI-ESM1-2-LR
- source_type :
- AOGCM
- status :
- 2020-07-12;created; by gcs.cmip6.ldeo@gmail.com
- sub_experiment :
- none
- sub_experiment_id :
- none
- table_id :
- Omon
- table_info :
- Creation Date:(09 May 2019) MD5:e6ef8ececc8f338646ebfb3aeed36bfc
- title :
- MPI-ESM1-2-LR output prepared for CMIP6
- tracking_id :
- hdl:21.14100/9a791e46-3b24-49f0-a628-66ef71241d7c hdl:21.14100/a649a192-9c9d-4e95-8ca4-f3f49e7cd1b5 hdl:21.14100/fbc8593c-4d93-4c0b-b493-6a79e49bb318 hdl:21.14100/97983dca-ea46-4c7b-8aa2-c099b198ad26 hdl:21.14100/631ac212-6092-487f-bf8e-637b1a850f75 hdl:21.14100/6f75eb76-155b-476d-9e3b-cbfd5750cf0f hdl:21.14100/8d74acf1-68e9-423c-8fe4-fcc7d902489a hdl:21.14100/0ede333a-9469-49f2-acda-bcaa109b463e hdl:21.14100/de98a355-ba0e-4cc2-9232-27bce75d9385
- variable_id :
- thetao
- variant_label :
- r2i1p1f1
- netcdf_tracking_ids :
- hdl:21.14100/9a791e46-3b24-49f0-a628-66ef71241d7c hdl:21.14100/a649a192-9c9d-4e95-8ca4-f3f49e7cd1b5 hdl:21.14100/fbc8593c-4d93-4c0b-b493-6a79e49bb318 hdl:21.14100/97983dca-ea46-4c7b-8aa2-c099b198ad26 hdl:21.14100/631ac212-6092-487f-bf8e-637b1a850f75 hdl:21.14100/6f75eb76-155b-476d-9e3b-cbfd5750cf0f hdl:21.14100/8d74acf1-68e9-423c-8fe4-fcc7d902489a hdl:21.14100/0ede333a-9469-49f2-acda-bcaa109b463e hdl:21.14100/de98a355-ba0e-4cc2-9232-27bce75d9385
- version_id :
- v20190710
- intake_esm_varname :
- None
- intake_esm_dataset_key :
- CMIP.MPI-M.MPI-ESM1-2-LR.historical.r2i1p1f1.Omon.thetao.gn.gs://cmip6/CMIP6/CMIP/MPI-M/MPI-ESM1-2-LR/historical/r2i1p1f1/Omon/thetao/gn/v20190710/.nan.20190710
In order to average temperature over both depth and the whole globe, we need to weight it by cell volume, which is simply the product of area and vertical thickness.
[20]:
fig, ax = plt.subplots()
for i, ds in enumerate(ddict_matched_again.values()):
# calculate the volume weighted mean ocean temperature
vol = (ds.areacello * ds.thkcello)
da = ds.thetao.isel(time=slice(-240, None)).weighted(vol.fillna(0)).mean(['x','y', 'lev']).squeeze().load()
da.plot(ax=ax, color=f'C{i}', label=ds.attrs['variant_label'])
ax.legend(bbox_to_anchor=(1, 1), loc='upper left')
[20]:
<matplotlib.legend.Legend at 0x1790e5880>
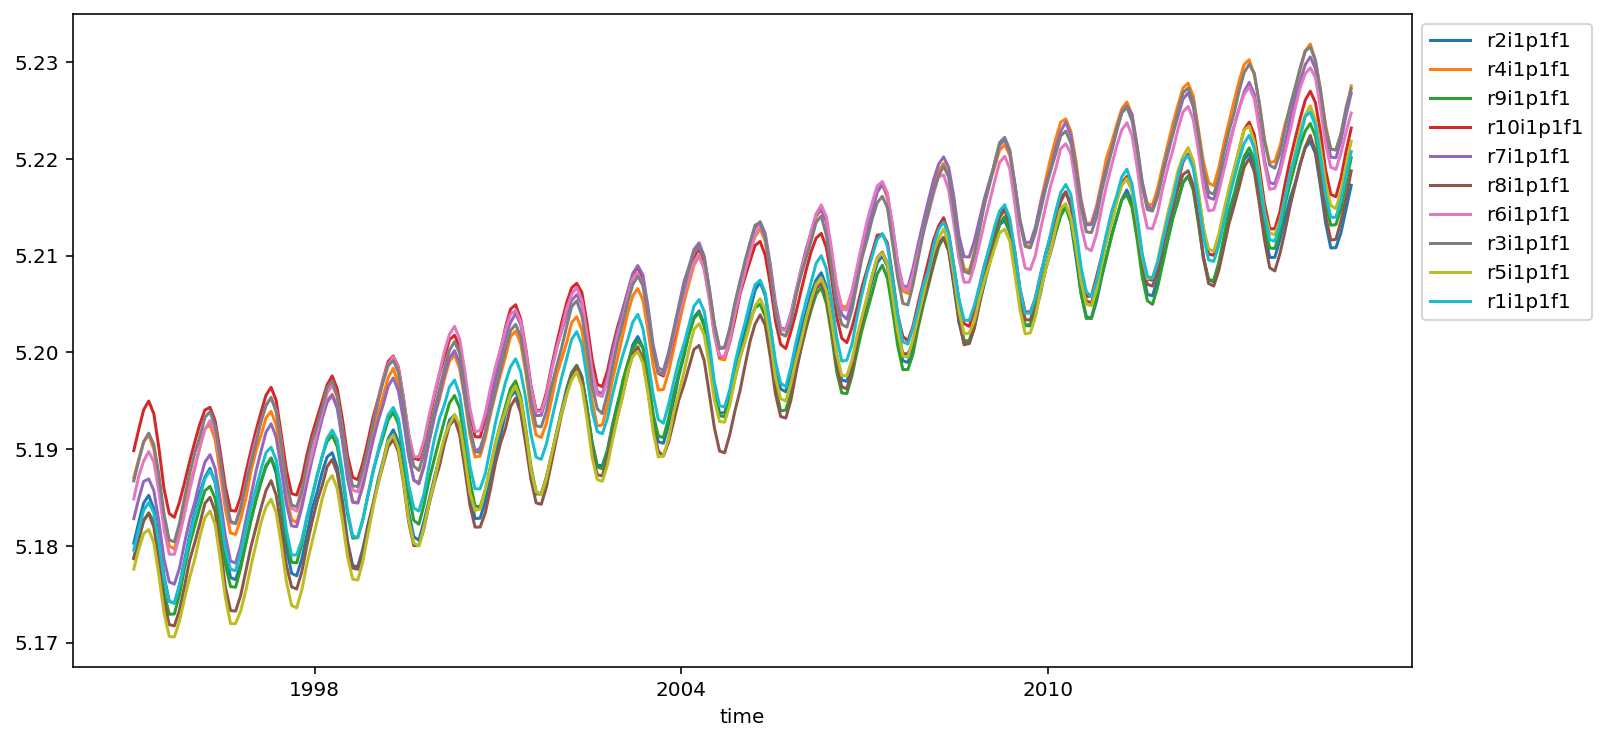
Matching metrics when the exact data is not available
Sometimes, for whatever reason, the exact metric data for a certain field might not be available. But in the case of static data, like cell area, we can assume that as long as the model (source_id) and the grid configuration (grid_label) are the same, we can use the cell area for all members.
Always check if these assumptions work in your case!
Within the pangeo cmip6 catalog there is one example of such a case for the FGOALS-f3-L model.
[21]:
cat_data = col.search(source_id='FGOALS-f3-L', variable_id='thetao', experiment_id=experiment_id, grid_label='gn', table_id='Omon')
ddict = cat_data.to_dataset_dict(**kwargs)
cat_metric = col.search(source_id='FGOALS-f3-L', variable_id='areacello', experiment_id='historical', grid_label='gn')
ddict_metrics = cat_metric.to_dataset_dict(**kwargs)
--> The keys in the returned dictionary of datasets are constructed as follows:
        'activity_id.institution_id.source_id.experiment_id.member_id.table_id.variable_id.grid_label.zstore.dcpp_init_year.version'
/Users/juliusbusecke/code/xmip/xmip/preprocessing.py:267: UserWarning: `FGOALS-f3-L` does not provide lon or lat bounds.
warnings.warn("`FGOALS-f3-L` does not provide lon or lat bounds.")
/Users/juliusbusecke/code/xmip/xmip/preprocessing.py:267: UserWarning: `FGOALS-f3-L` does not provide lon or lat bounds.
warnings.warn("`FGOALS-f3-L` does not provide lon or lat bounds.")
/Users/juliusbusecke/code/xmip/xmip/preprocessing.py:267: UserWarning: `FGOALS-f3-L` does not provide lon or lat bounds.
warnings.warn("`FGOALS-f3-L` does not provide lon or lat bounds.")
--> The keys in the returned dictionary of datasets are constructed as follows:
        'activity_id.institution_id.source_id.experiment_id.member_id.table_id.variable_id.grid_label.zstore.dcpp_init_year.version'
/Users/juliusbusecke/code/xmip/xmip/preprocessing.py:267: UserWarning: `FGOALS-f3-L` does not provide lon or lat bounds.
  warnings.warn("`FGOALS-f3-L` does not provide lon or lat bounds.")
[22]:
list(ddict.keys())
[22]:
['CMIP.CAS.FGOALS-f3-L.historical.r2i1p1f1.Omon.thetao.gn.gs://cmip6/CMIP6/CMIP/CAS/FGOALS-f3-L/historical/r2i1p1f1/Omon/thetao/gn/v20191008/.nan.20191008',
'CMIP.CAS.FGOALS-f3-L.historical.r1i1p1f1.Omon.thetao.gn.gs://cmip6/CMIP6/CMIP/CAS/FGOALS-f3-L/historical/r1i1p1f1/Omon/thetao/gn/v20190822/.nan.20190822',
'CMIP.CAS.FGOALS-f3-L.historical.r3i1p1f1.Omon.thetao.gn.gs://cmip6/CMIP6/CMIP/CAS/FGOALS-f3-L/historical/r3i1p1f1/Omon/thetao/gn/v20191008/.nan.20191008']
[23]:
list(ddict_metrics.keys())
[23]:
['CMIP.CAS.FGOALS-f3-L.historical.r1i1p1f1.Ofx.areacello.gn.gs://cmip6/CMIP6/CMIP/CAS/FGOALS-f3-L/historical/r1i1p1f1/Ofx/areacello/gn/v20190918/.nan.20190918']
We can see that there are three members and only one of them has output for the cell area.
By default match_metrics will use any available metric data that has the same source_id and grid_label attributes.
[24]:
ddict_matched = match_metrics(ddict, ddict_metrics, ['areacello'])
[25]:
ds = ddict_matched['CMIP.CAS.FGOALS-f3-L.historical.r2i1p1f1.Omon.thetao.gn.gs://cmip6/CMIP6/CMIP/CAS/FGOALS-f3-L/historical/r2i1p1f1/Omon/thetao/gn/v20191008/.nan.20191008']
ds
[25]:
<xarray.Dataset>
Dimensions: (bnds: 2, lev: 30, time: 1980, x: 360, y: 218)
Coordinates:
* x (x) int32 0 1 2 3 4 5 6 7 8 ... 352 353 354 355 356 357 358 359
* y (y) int32 0 1 2 3 4 5 6 7 8 ... 210 211 212 213 214 215 216 217
lat (y, x) float64 dask.array<chunksize=(218, 360), meta=np.ndarray>
* lev (lev) float64 5.0 15.0 25.0 ... 3.856e+03 4.538e+03 5.244e+03
lev_bounds (lev, bnds) float64 dask.array<chunksize=(30, 2), meta=np.ndarray>
lon (y, x) float64 dask.array<chunksize=(218, 360), meta=np.ndarray>
* time (time) object 1850-01-16 13:00:00.000007 ... 2014-12-16 12:0...
time_bounds (time, bnds) object dask.array<chunksize=(1980, 2), meta=np.ndarray>
* bnds (bnds) int64 0 1
areacello (y, x) float32 dask.array<chunksize=(218, 360), meta=np.ndarray>
Data variables:
thetao (time, lev, y, x) float32 dask.array<chunksize=(5, 30, 218, 360), meta=np.ndarray>
Attributes:
Conventions: CF-1.7 CMIP-6.2
NCO: netCDF Operators version 4.8.1 (Homepage = http:...
activity_id: CMIP
branch_method: Spin-up documentation
branch_time_in_child: 674885.0
branch_time_in_parent: 236885.0
cmor_version: 3.4.0
contact: Yongqiang Yu(yyq@lasg.iap.ac.cn)
creation_date: 2019-10-07T20:29:01Z
data_specs_version: 01.00.30
experiment: all-forcing simulation of the recent past
experiment_id: historical
external_variables: areacello volcello
forcing_index: 1
frequency: mon
further_info_url: https://furtherinfo.es-doc.org/CMIP6.CAS.FGOALS-...
grid: gs1x1
grid_label: gn
history: Thu Nov 14 10:13:24 2019: ncatted -O -a license,...
initialization_index: 1
institution: Chinese Academy of Sciences, Beijing 100029, China
institution_id: CAS
license: CMIP6 model data produced by LASG, Institute of ...
mip_era: CMIP6
nominal_resolution: 100 km
parent_activity_id: CMIP
parent_experiment_id: piControl
parent_mip_era: CMIP6
parent_source_id: FGOALS-f3-L
parent_time_units: days since 0001-01-01
parent_variant_label: r1i1p1f1
physics_index: 1
product: model-output
realization_index: 2
realm: ocean
references: Model described by Yu et al.2019,
run_variant: forcing: black carbon aerosol only
source: FGOALS-f3-L (2017): \naerosol: none\natmos: FAMI...
source_id: FGOALS-f3-L
source_type: AOGCM
status: 2020-12-20;created; by gcs.cmip6.ldeo@gmail.com
sub_experiment: none
sub_experiment_id: none
table_id: Omon
table_info: Creation Date:(09 May 2019) MD5:cde930676e68ac67...
title: FGOALS-f3-L output prepared for CMIP6
tracking_id: hdl:21.14100/425a2350-df4c-4657-9b9d-5717e8cd983...
variable_id: thetao
variant_label: r2i1p1f1
netcdf_tracking_ids: hdl:21.14100/425a2350-df4c-4657-9b9d-5717e8cd983...
version_id: v20191008
intake_esm_varname: None
intake_esm_dataset_key: CMIP.CAS.FGOALS-f3-L.historical.r2i1p1f1.Omon.th...- bnds: 2
- lev: 30
- time: 1980
- x: 360
- y: 218
- x(x)int320 1 2 3 4 5 ... 355 356 357 358 359
- long_name :
- cell index along first dimension
- units :
- 1
array([ 0, 1, 2, ..., 357, 358, 359], dtype=int32)
- y(y)int320 1 2 3 4 5 ... 213 214 215 216 217
- long_name :
- cell index along second dimension
- units :
- 1
array([ 0, 1, 2, ..., 215, 216, 217], dtype=int32)
- lat(y, x)float64dask.array<chunksize=(218, 360), meta=np.ndarray>
- long_name :
- latitude
- standard_name :
- latitude
- units :
- degrees_north
Array Chunk Bytes 627.84 kB 627.84 kB Shape (218, 360) (218, 360) Count 5 Tasks 1 Chunks Type float64 numpy.ndarray - lev(lev)float645.0 15.0 ... 4.538e+03 5.244e+03
- axis :
- Z
- bounds :
- lev_bnds
- long_name :
- ocean depth coordinate
- positive :
- down
- standard_name :
- depth
- units :
- m
array([5.000000e+00, 1.500000e+01, 2.500000e+01, 3.500000e+01, 4.500000e+01, 5.500000e+01, 6.500000e+01, 7.500000e+01, 8.500000e+01, 9.500000e+01, 1.050000e+02, 1.150000e+02, 1.250000e+02, 1.350000e+02, 1.450000e+02, 1.569303e+02, 1.784277e+02, 2.225018e+02, 3.031057e+02, 4.325961e+02, 6.211931e+02, 8.765334e+02, 1.203337e+03, 1.603200e+03, 2.074526e+03, 2.612596e+03, 3.209772e+03, 3.855835e+03, 4.538428e+03, 5.243597e+03]) - lev_bounds(lev, bnds)float64dask.array<chunksize=(30, 2), meta=np.ndarray>
Array Chunk Bytes 480 B 480 B Shape (30, 2) (30, 2) Count 2 Tasks 1 Chunks Type float64 numpy.ndarray - lon(y, x)float64dask.array<chunksize=(218, 360), meta=np.ndarray>
- long_name :
- longitude
- standard_name :
- longitude
- units :
- degrees_east
Array Chunk Bytes 627.84 kB 627.84 kB Shape (218, 360) (218, 360) Count 8 Tasks 1 Chunks Type float64 numpy.ndarray - time(time)object1850-01-16 13:00:00.000007 ... 2...
- axis :
- T
- bounds :
- time_bnds
- long_name :
- time
- standard_name :
- time
array([cftime.DatetimeNoLeap(1850, 1, 16, 13, 0, 0, 7), cftime.DatetimeNoLeap(1850, 2, 15, 0, 0, 0, 0), cftime.DatetimeNoLeap(1850, 3, 16, 12, 0, 0, 0), ..., cftime.DatetimeNoLeap(2014, 10, 16, 12, 0, 0, 0), cftime.DatetimeNoLeap(2014, 11, 16, 0, 0, 0, 0), cftime.DatetimeNoLeap(2014, 12, 16, 12, 0, 0, 0)], dtype=object) - time_bounds(time, bnds)objectdask.array<chunksize=(1980, 2), meta=np.ndarray>
Array Chunk Bytes 31.68 kB 31.68 kB Shape (1980, 2) (1980, 2) Count 2 Tasks 1 Chunks Type object numpy.ndarray - bnds(bnds)int640 1
array([0, 1])
- areacello(y, x)float32dask.array<chunksize=(218, 360), meta=np.ndarray>
- cell_methods :
- area: sum
- comment :
- Horizontal area of ocean grid cells
- long_name :
- Grid-Cell Area for Ocean Variables
- standard_name :
- cell_area
- units :
- m2
- original_key :
- CMIP.CAS.FGOALS-f3-L.historical.r1i1p1f1.Ofx.areacello.gn.gs://cmip6/CMIP6/CMIP/CAS/FGOALS-f3-L/historical/r1i1p1f1/Ofx/areacello/gn/v20190918/.nan.20190918
- parsed_with :
- xmip/postprocessing/parse_metric
Array Chunk Bytes 313.92 kB 313.92 kB Shape (218, 360) (218, 360) Count 2 Tasks 1 Chunks Type float32 numpy.ndarray
- thetao(time, lev, y, x)float32dask.array<chunksize=(5, 30, 218, 360), meta=np.ndarray>
- cell_measures :
- area: areacello volume: volcello
- cell_methods :
- area: mean where sea time: mean
- comment :
- Diagnostic should be contributed even for models using conservative temperature as prognostic field.
- history :
- 2019-10-07T20:24:42Z altered by CMOR: replaced missing value flag (1e+35) with standard missing value (1e+20).
- long_name :
- Sea Water Potential Temperature
- standard_name :
- sea_water_potential_temperature
- units :
- degC
Array Chunk Bytes 18.65 GB 47.09 MB Shape (1980, 30, 218, 360) (5, 30, 218, 360) Count 397 Tasks 396 Chunks Type float32 numpy.ndarray
- Conventions :
- CF-1.7 CMIP-6.2
- NCO :
- netCDF Operators version 4.8.1 (Homepage = http://nco.sf.net, Code = http://github.com/nco/nco)
- activity_id :
- CMIP
- branch_method :
- Spin-up documentation
- branch_time_in_child :
- 674885.0
- branch_time_in_parent :
- 236885.0
- cmor_version :
- 3.4.0
- contact :
- Yongqiang Yu(yyq@lasg.iap.ac.cn)
- creation_date :
- 2019-10-07T20:29:01Z
- data_specs_version :
- 01.00.30
- experiment :
- all-forcing simulation of the recent past
- experiment_id :
- historical
- external_variables :
- areacello volcello
- forcing_index :
- 1
- frequency :
- mon
- further_info_url :
- https://furtherinfo.es-doc.org/CMIP6.CAS.FGOALS-f3-L.historical.none.r2i1p1f1
- grid :
- gs1x1
- grid_label :
- gn
- history :
- Thu Nov 14 10:13:24 2019: ncatted -O -a license,global,m,c,CMIP6 model data produced by LASG, Institute of Atmospheric Physics, Chinese Academy of Sciences is licensed under a Creative Commons Attribution ShareAlike 4.0 International License (https://creativecommons.org/licenses/). Consult https://pcmdi.llnl.gov/CMIP6/TermsOfUse for terms of use governing CMIP6 output, including citation requirements and proper acknowledgment. Further information about this data, including some limitations, can be found via the further_info_url (recorded as a global attribute in this file) http://model.lasg.ac.cn. The data producers and data providers make no warranty, either express or implied, including, but not limited to, warranties of merchantability and fitness for a particular purpose. All liabilities arising from the supply of the information (including any liability arising in negligence) are excluded to the fullest extent permitted by law. thetao_Omon_FGOALS-f3-L_historical_r2i1p1f1_gn_185001-189912.nc 2019-10-07T11:49:19Z ;rewrote data to be consistent with CMIP for variable uo found in table Omon.
- initialization_index :
- 1
- institution :
- Chinese Academy of Sciences, Beijing 100029, China
- institution_id :
- CAS
- license :
- CMIP6 model data produced by LASG, Institute of Atmospheric Physics, Chinese Academy of Sciences is licensed under a Creative Commons Attribution ShareAlike 4.0 International License (https://creativecommons.org/licenses/). Consult https://pcmdi.llnl.gov/CMIP6/TermsOfUse for terms of use governing CMIP6 output, including citation requirements and proper acknowledgment. Further information about this data, including some limitations, can be found via the further_info_url (recorded as a global attribute in this file) http://model.lasg.ac.cn. The data producers and data providers make no warranty, either express or implied, including, but not limited to, warranties of merchantability and fitness for a particular purpose. All liabilities arising from the supply of the information (including any liability arising in negligence) are excluded to the fullest extent permitted by law.
- mip_era :
- CMIP6
- nominal_resolution :
- 100 km
- parent_activity_id :
- CMIP
- parent_experiment_id :
- piControl
- parent_mip_era :
- CMIP6
- parent_source_id :
- FGOALS-f3-L
- parent_time_units :
- days since 0001-01-01
- parent_variant_label :
- r1i1p1f1
- physics_index :
- 1
- product :
- model-output
- realization_index :
- 2
- realm :
- ocean
- references :
- Model described by Yu et al.2019,
- run_variant :
- forcing: black carbon aerosol only
- source :
- FGOALS-f3-L (2017): aerosol: none atmos: FAMIL2.2 (Cubed-sphere, c96; 360 x 180 longitude/latitude; 32 levels; top level 2.16 hPa) atmosChem: none land: CLM4.0 landIce: none ocean: LICOM3.0 (LICOM3.0, tripolar primarily 1deg; 360 x 218 longitude/latitude; 30 levels; top grid cell 0-10 m) ocnBgchem: none seaIce: CICE4.0
- source_id :
- FGOALS-f3-L
- source_type :
- AOGCM
- status :
- 2020-12-20;created; by gcs.cmip6.ldeo@gmail.com
- sub_experiment :
- none
- sub_experiment_id :
- none
- table_id :
- Omon
- table_info :
- Creation Date:(09 May 2019) MD5:cde930676e68ac6780d5e4c62d3898f6
- title :
- FGOALS-f3-L output prepared for CMIP6
- tracking_id :
- hdl:21.14100/425a2350-df4c-4657-9b9d-5717e8cd983e hdl:21.14100/c1c944ad-9462-4d17-a180-ac92b446d5cf hdl:21.14100/0e178278-6eca-4950-b703-1ee31604bdb5
- variable_id :
- thetao
- variant_label :
- r2i1p1f1
- netcdf_tracking_ids :
- hdl:21.14100/425a2350-df4c-4657-9b9d-5717e8cd983e hdl:21.14100/c1c944ad-9462-4d17-a180-ac92b446d5cf hdl:21.14100/0e178278-6eca-4950-b703-1ee31604bdb5
- version_id :
- v20191008
- intake_esm_varname :
- None
- intake_esm_dataset_key :
- CMIP.CAS.FGOALS-f3-L.historical.r2i1p1f1.Omon.thetao.gn.gs://cmip6/CMIP6/CMIP/CAS/FGOALS-f3-L/historical/r2i1p1f1/Omon/thetao/gn/v20191008/.nan.20191008
You can see that even the other members have an areacello coordinate now. The attributes of the dataarray give some hints where this data was coming from
[26]:
ds.areacello.attrs
[26]:
{'cell_methods': 'area: sum',
'comment': 'Horizontal area of ocean grid cells',
'long_name': 'Grid-Cell Area for Ocean Variables',
'standard_name': 'cell_area',
'units': 'm2',
'original_key': 'CMIP.CAS.FGOALS-f3-L.historical.r1i1p1f1.Ofx.areacello.gn.gs://cmip6/CMIP6/CMIP/CAS/FGOALS-f3-L/historical/r1i1p1f1/Ofx/areacello/gn/v20190918/.nan.20190918',
'parsed_with': 'xmip/postprocessing/parse_metric'}
The original_key field preserves the dictionary key of ddict_metrics, which in this case has all the information to find the actual source file.
If you are using this withouth `intake-esm <>`__ your keys might be different and this output might be less useful.
You have fine-grained control over which datasets attributes are used for the matching between datasets and metrics.
For example, adding variant_label to the list of matched attributes, metrics will only be parse for dataset/metric pairs that have the exact same variant_label.
[27]:
ddict_matched_strict = match_metrics(ddict, ddict_metrics, ['areacello'], match_attrs=['source_id', 'grid_label', 'variant_label'])
ds_strict = ddict_matched_strict['CMIP.CAS.FGOALS-f3-L.historical.r2i1p1f1.Omon.thetao.gn.gs://cmip6/CMIP6/CMIP/CAS/FGOALS-f3-L/historical/r2i1p1f1/Omon/thetao/gn/v20191008/.nan.20191008']
ds_strict
/Users/juliusbusecke/code/xmip/xmip/postprocessing.py:126: UserWarning: No matching metrics found for areacello
warnings.warn(f"No matching metrics found for {mv}")
[27]:
<xarray.Dataset>
Dimensions: (bnds: 2, lev: 30, time: 1980, x: 360, y: 218)
Coordinates:
* x (x) int32 0 1 2 3 4 5 6 7 8 ... 352 353 354 355 356 357 358 359
* y (y) int32 0 1 2 3 4 5 6 7 8 ... 210 211 212 213 214 215 216 217
lat (y, x) float64 dask.array<chunksize=(218, 360), meta=np.ndarray>
* lev (lev) float64 5.0 15.0 25.0 ... 3.856e+03 4.538e+03 5.244e+03
lev_bounds (lev, bnds) float64 dask.array<chunksize=(30, 2), meta=np.ndarray>
lon (y, x) float64 dask.array<chunksize=(218, 360), meta=np.ndarray>
* time (time) object 1850-01-16 13:00:00.000007 ... 2014-12-16 12:0...
time_bounds (time, bnds) object dask.array<chunksize=(1980, 2), meta=np.ndarray>
* bnds (bnds) int64 0 1
Data variables:
thetao (time, lev, y, x) float32 dask.array<chunksize=(5, 30, 218, 360), meta=np.ndarray>
Attributes:
Conventions: CF-1.7 CMIP-6.2
NCO: netCDF Operators version 4.8.1 (Homepage = http:...
activity_id: CMIP
branch_method: Spin-up documentation
branch_time_in_child: 674885.0
branch_time_in_parent: 236885.0
cmor_version: 3.4.0
contact: Yongqiang Yu(yyq@lasg.iap.ac.cn)
creation_date: 2019-10-07T20:29:01Z
data_specs_version: 01.00.30
experiment: all-forcing simulation of the recent past
experiment_id: historical
external_variables: areacello volcello
forcing_index: 1
frequency: mon
further_info_url: https://furtherinfo.es-doc.org/CMIP6.CAS.FGOALS-...
grid: gs1x1
grid_label: gn
history: Thu Nov 14 10:13:24 2019: ncatted -O -a license,...
initialization_index: 1
institution: Chinese Academy of Sciences, Beijing 100029, China
institution_id: CAS
license: CMIP6 model data produced by LASG, Institute of ...
mip_era: CMIP6
nominal_resolution: 100 km
parent_activity_id: CMIP
parent_experiment_id: piControl
parent_mip_era: CMIP6
parent_source_id: FGOALS-f3-L
parent_time_units: days since 0001-01-01
parent_variant_label: r1i1p1f1
physics_index: 1
product: model-output
realization_index: 2
realm: ocean
references: Model described by Yu et al.2019,
run_variant: forcing: black carbon aerosol only
source: FGOALS-f3-L (2017): \naerosol: none\natmos: FAMI...
source_id: FGOALS-f3-L
source_type: AOGCM
status: 2020-12-20;created; by gcs.cmip6.ldeo@gmail.com
sub_experiment: none
sub_experiment_id: none
table_id: Omon
table_info: Creation Date:(09 May 2019) MD5:cde930676e68ac67...
title: FGOALS-f3-L output prepared for CMIP6
tracking_id: hdl:21.14100/425a2350-df4c-4657-9b9d-5717e8cd983...
variable_id: thetao
variant_label: r2i1p1f1
netcdf_tracking_ids: hdl:21.14100/425a2350-df4c-4657-9b9d-5717e8cd983...
version_id: v20191008
intake_esm_varname: None
intake_esm_dataset_key: CMIP.CAS.FGOALS-f3-L.historical.r2i1p1f1.Omon.th...- bnds: 2
- lev: 30
- time: 1980
- x: 360
- y: 218
- x(x)int320 1 2 3 4 5 ... 355 356 357 358 359
- long_name :
- cell index along first dimension
- units :
- 1
array([ 0, 1, 2, ..., 357, 358, 359], dtype=int32)
- y(y)int320 1 2 3 4 5 ... 213 214 215 216 217
- long_name :
- cell index along second dimension
- units :
- 1
array([ 0, 1, 2, ..., 215, 216, 217], dtype=int32)
- lat(y, x)float64dask.array<chunksize=(218, 360), meta=np.ndarray>
- long_name :
- latitude
- standard_name :
- latitude
- units :
- degrees_north
Array Chunk Bytes 627.84 kB 627.84 kB Shape (218, 360) (218, 360) Count 5 Tasks 1 Chunks Type float64 numpy.ndarray - lev(lev)float645.0 15.0 ... 4.538e+03 5.244e+03
- axis :
- Z
- bounds :
- lev_bnds
- long_name :
- ocean depth coordinate
- positive :
- down
- standard_name :
- depth
- units :
- m
array([5.000000e+00, 1.500000e+01, 2.500000e+01, 3.500000e+01, 4.500000e+01, 5.500000e+01, 6.500000e+01, 7.500000e+01, 8.500000e+01, 9.500000e+01, 1.050000e+02, 1.150000e+02, 1.250000e+02, 1.350000e+02, 1.450000e+02, 1.569303e+02, 1.784277e+02, 2.225018e+02, 3.031057e+02, 4.325961e+02, 6.211931e+02, 8.765334e+02, 1.203337e+03, 1.603200e+03, 2.074526e+03, 2.612596e+03, 3.209772e+03, 3.855835e+03, 4.538428e+03, 5.243597e+03]) - lev_bounds(lev, bnds)float64dask.array<chunksize=(30, 2), meta=np.ndarray>
Array Chunk Bytes 480 B 480 B Shape (30, 2) (30, 2) Count 2 Tasks 1 Chunks Type float64 numpy.ndarray - lon(y, x)float64dask.array<chunksize=(218, 360), meta=np.ndarray>
- long_name :
- longitude
- standard_name :
- longitude
- units :
- degrees_east
Array Chunk Bytes 627.84 kB 627.84 kB Shape (218, 360) (218, 360) Count 8 Tasks 1 Chunks Type float64 numpy.ndarray - time(time)object1850-01-16 13:00:00.000007 ... 2...
- axis :
- T
- bounds :
- time_bnds
- long_name :
- time
- standard_name :
- time
array([cftime.DatetimeNoLeap(1850, 1, 16, 13, 0, 0, 7), cftime.DatetimeNoLeap(1850, 2, 15, 0, 0, 0, 0), cftime.DatetimeNoLeap(1850, 3, 16, 12, 0, 0, 0), ..., cftime.DatetimeNoLeap(2014, 10, 16, 12, 0, 0, 0), cftime.DatetimeNoLeap(2014, 11, 16, 0, 0, 0, 0), cftime.DatetimeNoLeap(2014, 12, 16, 12, 0, 0, 0)], dtype=object) - time_bounds(time, bnds)objectdask.array<chunksize=(1980, 2), meta=np.ndarray>
Array Chunk Bytes 31.68 kB 31.68 kB Shape (1980, 2) (1980, 2) Count 2 Tasks 1 Chunks Type object numpy.ndarray - bnds(bnds)int640 1
array([0, 1])
- thetao(time, lev, y, x)float32dask.array<chunksize=(5, 30, 218, 360), meta=np.ndarray>
- cell_measures :
- area: areacello volume: volcello
- cell_methods :
- area: mean where sea time: mean
- comment :
- Diagnostic should be contributed even for models using conservative temperature as prognostic field.
- history :
- 2019-10-07T20:24:42Z altered by CMOR: replaced missing value flag (1e+35) with standard missing value (1e+20).
- long_name :
- Sea Water Potential Temperature
- standard_name :
- sea_water_potential_temperature
- units :
- degC
Array Chunk Bytes 18.65 GB 47.09 MB Shape (1980, 30, 218, 360) (5, 30, 218, 360) Count 397 Tasks 396 Chunks Type float32 numpy.ndarray
- Conventions :
- CF-1.7 CMIP-6.2
- NCO :
- netCDF Operators version 4.8.1 (Homepage = http://nco.sf.net, Code = http://github.com/nco/nco)
- activity_id :
- CMIP
- branch_method :
- Spin-up documentation
- branch_time_in_child :
- 674885.0
- branch_time_in_parent :
- 236885.0
- cmor_version :
- 3.4.0
- contact :
- Yongqiang Yu(yyq@lasg.iap.ac.cn)
- creation_date :
- 2019-10-07T20:29:01Z
- data_specs_version :
- 01.00.30
- experiment :
- all-forcing simulation of the recent past
- experiment_id :
- historical
- external_variables :
- areacello volcello
- forcing_index :
- 1
- frequency :
- mon
- further_info_url :
- https://furtherinfo.es-doc.org/CMIP6.CAS.FGOALS-f3-L.historical.none.r2i1p1f1
- grid :
- gs1x1
- grid_label :
- gn
- history :
- Thu Nov 14 10:13:24 2019: ncatted -O -a license,global,m,c,CMIP6 model data produced by LASG, Institute of Atmospheric Physics, Chinese Academy of Sciences is licensed under a Creative Commons Attribution ShareAlike 4.0 International License (https://creativecommons.org/licenses/). Consult https://pcmdi.llnl.gov/CMIP6/TermsOfUse for terms of use governing CMIP6 output, including citation requirements and proper acknowledgment. Further information about this data, including some limitations, can be found via the further_info_url (recorded as a global attribute in this file) http://model.lasg.ac.cn. The data producers and data providers make no warranty, either express or implied, including, but not limited to, warranties of merchantability and fitness for a particular purpose. All liabilities arising from the supply of the information (including any liability arising in negligence) are excluded to the fullest extent permitted by law. thetao_Omon_FGOALS-f3-L_historical_r2i1p1f1_gn_185001-189912.nc 2019-10-07T11:49:19Z ;rewrote data to be consistent with CMIP for variable uo found in table Omon.
- initialization_index :
- 1
- institution :
- Chinese Academy of Sciences, Beijing 100029, China
- institution_id :
- CAS
- license :
- CMIP6 model data produced by LASG, Institute of Atmospheric Physics, Chinese Academy of Sciences is licensed under a Creative Commons Attribution ShareAlike 4.0 International License (https://creativecommons.org/licenses/). Consult https://pcmdi.llnl.gov/CMIP6/TermsOfUse for terms of use governing CMIP6 output, including citation requirements and proper acknowledgment. Further information about this data, including some limitations, can be found via the further_info_url (recorded as a global attribute in this file) http://model.lasg.ac.cn. The data producers and data providers make no warranty, either express or implied, including, but not limited to, warranties of merchantability and fitness for a particular purpose. All liabilities arising from the supply of the information (including any liability arising in negligence) are excluded to the fullest extent permitted by law.
- mip_era :
- CMIP6
- nominal_resolution :
- 100 km
- parent_activity_id :
- CMIP
- parent_experiment_id :
- piControl
- parent_mip_era :
- CMIP6
- parent_source_id :
- FGOALS-f3-L
- parent_time_units :
- days since 0001-01-01
- parent_variant_label :
- r1i1p1f1
- physics_index :
- 1
- product :
- model-output
- realization_index :
- 2
- realm :
- ocean
- references :
- Model described by Yu et al.2019,
- run_variant :
- forcing: black carbon aerosol only
- source :
- FGOALS-f3-L (2017): aerosol: none atmos: FAMIL2.2 (Cubed-sphere, c96; 360 x 180 longitude/latitude; 32 levels; top level 2.16 hPa) atmosChem: none land: CLM4.0 landIce: none ocean: LICOM3.0 (LICOM3.0, tripolar primarily 1deg; 360 x 218 longitude/latitude; 30 levels; top grid cell 0-10 m) ocnBgchem: none seaIce: CICE4.0
- source_id :
- FGOALS-f3-L
- source_type :
- AOGCM
- status :
- 2020-12-20;created; by gcs.cmip6.ldeo@gmail.com
- sub_experiment :
- none
- sub_experiment_id :
- none
- table_id :
- Omon
- table_info :
- Creation Date:(09 May 2019) MD5:cde930676e68ac6780d5e4c62d3898f6
- title :
- FGOALS-f3-L output prepared for CMIP6
- tracking_id :
- hdl:21.14100/425a2350-df4c-4657-9b9d-5717e8cd983e hdl:21.14100/c1c944ad-9462-4d17-a180-ac92b446d5cf hdl:21.14100/0e178278-6eca-4950-b703-1ee31604bdb5
- variable_id :
- thetao
- variant_label :
- r2i1p1f1
- netcdf_tracking_ids :
- hdl:21.14100/425a2350-df4c-4657-9b9d-5717e8cd983e hdl:21.14100/c1c944ad-9462-4d17-a180-ac92b446d5cf hdl:21.14100/0e178278-6eca-4950-b703-1ee31604bdb5
- version_id :
- v20191008
- intake_esm_varname :
- None
- intake_esm_dataset_key :
- CMIP.CAS.FGOALS-f3-L.historical.r2i1p1f1.Omon.thetao.gn.gs://cmip6/CMIP6/CMIP/CAS/FGOALS-f3-L/historical/r2i1p1f1/Omon/thetao/gn/v20191008/.nan.20191008
The one member that has an exact matched metric will still get it.
[28]:
ds_strict_matched = ddict_matched_strict['CMIP.CAS.FGOALS-f3-L.historical.r1i1p1f1.Omon.thetao.gn.gs://cmip6/CMIP6/CMIP/CAS/FGOALS-f3-L/historical/r1i1p1f1/Omon/thetao/gn/v20190822/.nan.20190822']
ds_strict_matched
[28]:
<xarray.Dataset>
Dimensions: (bnds: 2, lev: 30, time: 1980, x: 360, y: 218)
Coordinates:
* x (x) int32 0 1 2 3 4 5 6 7 8 ... 352 353 354 355 356 357 358 359
* y (y) int32 0 1 2 3 4 5 6 7 8 ... 210 211 212 213 214 215 216 217
lat (y, x) float64 dask.array<chunksize=(218, 360), meta=np.ndarray>
* lev (lev) float64 5.0 15.0 25.0 ... 3.856e+03 4.538e+03 5.244e+03
lev_bounds (lev, bnds) float64 dask.array<chunksize=(30, 2), meta=np.ndarray>
lon (y, x) float64 dask.array<chunksize=(218, 360), meta=np.ndarray>
* time (time) object 1850-01-16 13:00:00 ... 2014-12-16 12:00:00
time_bounds (time, bnds) object dask.array<chunksize=(1980, 2), meta=np.ndarray>
* bnds (bnds) int64 0 1
areacello (y, x) float32 dask.array<chunksize=(218, 360), meta=np.ndarray>
Data variables:
thetao (time, lev, y, x) float32 dask.array<chunksize=(10, 30, 218, 360), meta=np.ndarray>
Attributes:
Conventions: CF-1.7 CMIP-6.2
activity_id: CMIP
branch_method: Spin-up documentation
branch_time_in_child: 674885.0
branch_time_in_parent: 218635.0
cmor_version: 3.4.0
contact: Yongqiang Yu(yyq@lasg.iap.ac.cn)
creation_date: 2019-08-22T15:40:13Z
data_specs_version: 01.00.30
experiment: all-forcing simulation of the recent past
experiment_id: historical
external_variables: areacello volcello
forcing_index: 1
frequency: mon
further_info_url: https://furtherinfo.es-doc.org/CMIP6.CAS.FGOALS-...
grid: gs1x1
grid_label: gn
history: 2019-08-22T13:32:56Z ;rewrote data to be consist...
initialization_index: 1
institution: Chinese Academy of Sciences, Beijing 100029, China
institution_id: CAS
license: CMIP6 model data produced by Lawrence Livermore ...
mip_era: CMIP6
nominal_resolution: 100 km
parent_activity_id: CMIP
parent_experiment_id: piControl
parent_mip_era: CMIP6
parent_source_id: FGOALS-f3-L
parent_time_units: days since 0001-01-01
parent_variant_label: r1i1p1f1
physics_index: 1
product: model-output
realization_index: 1
realm: ocean
references: Model described by Yu et al.2019,
run_variant: forcing: black carbon aerosol only
source: FGOALS-f3-L (2017): \naerosol: none\natmos: FAMI...
source_id: FGOALS-f3-L
source_type: AOGCM
sub_experiment: none
sub_experiment_id: none
table_id: Omon
table_info: Creation Date:(09 May 2019) MD5:cde930676e68ac67...
title: FGOALS-f3-L output prepared for CMIP6
tracking_id: hdl:21.14100/1cddc583-15f9-4315-b09b-1bc2cef6198...
variable_id: thetao
variant_label: r1i1p1f1
status: 2019-10-25;created;by nhn2@columbia.edu
netcdf_tracking_ids: hdl:21.14100/1cddc583-15f9-4315-b09b-1bc2cef6198...
version_id: v20190822
intake_esm_varname: None
intake_esm_dataset_key: CMIP.CAS.FGOALS-f3-L.historical.r1i1p1f1.Omon.th...- bnds: 2
- lev: 30
- time: 1980
- x: 360
- y: 218
- x(x)int320 1 2 3 4 5 ... 355 356 357 358 359
- long_name :
- cell index along first dimension
- units :
- 1
array([ 0, 1, 2, ..., 357, 358, 359], dtype=int32)
- y(y)int320 1 2 3 4 5 ... 213 214 215 216 217
- long_name :
- cell index along second dimension
- units :
- 1
array([ 0, 1, 2, ..., 215, 216, 217], dtype=int32)
- lat(y, x)float64dask.array<chunksize=(218, 360), meta=np.ndarray>
- long_name :
- latitude
- standard_name :
- latitude
- units :
- degrees_north
Array Chunk Bytes 627.84 kB 627.84 kB Shape (218, 360) (218, 360) Count 5 Tasks 1 Chunks Type float64 numpy.ndarray - lev(lev)float645.0 15.0 ... 4.538e+03 5.244e+03
- axis :
- Z
- bounds :
- lev_bnds
- long_name :
- ocean depth coordinate
- positive :
- down
- standard_name :
- depth
- units :
- m
array([5.000000e+00, 1.500000e+01, 2.500000e+01, 3.500000e+01, 4.500000e+01, 5.500000e+01, 6.500000e+01, 7.500000e+01, 8.500000e+01, 9.500000e+01, 1.050000e+02, 1.150000e+02, 1.250000e+02, 1.350000e+02, 1.450000e+02, 1.569303e+02, 1.784277e+02, 2.225018e+02, 3.031057e+02, 4.325961e+02, 6.211931e+02, 8.765334e+02, 1.203337e+03, 1.603200e+03, 2.074526e+03, 2.612596e+03, 3.209772e+03, 3.855835e+03, 4.538428e+03, 5.243597e+03]) - lev_bounds(lev, bnds)float64dask.array<chunksize=(30, 2), meta=np.ndarray>
Array Chunk Bytes 480 B 480 B Shape (30, 2) (30, 2) Count 2 Tasks 1 Chunks Type float64 numpy.ndarray - lon(y, x)float64dask.array<chunksize=(218, 360), meta=np.ndarray>
- long_name :
- longitude
- standard_name :
- longitude
- units :
- degrees_east
Array Chunk Bytes 627.84 kB 627.84 kB Shape (218, 360) (218, 360) Count 8 Tasks 1 Chunks Type float64 numpy.ndarray - time(time)object1850-01-16 13:00:00 ... 2014-12-...
- axis :
- T
- bounds :
- time_bnds
- long_name :
- time
- standard_name :
- time
array([cftime.DatetimeNoLeap(1850, 1, 16, 13, 0, 0, 0), cftime.DatetimeNoLeap(1850, 2, 15, 0, 0, 0, 0), cftime.DatetimeNoLeap(1850, 3, 16, 12, 0, 0, 0), ..., cftime.DatetimeNoLeap(2014, 10, 16, 12, 0, 0, 0), cftime.DatetimeNoLeap(2014, 11, 16, 0, 0, 0, 0), cftime.DatetimeNoLeap(2014, 12, 16, 12, 0, 0, 0)], dtype=object) - time_bounds(time, bnds)objectdask.array<chunksize=(1980, 2), meta=np.ndarray>
Array Chunk Bytes 31.68 kB 31.68 kB Shape (1980, 2) (1980, 2) Count 2 Tasks 1 Chunks Type object numpy.ndarray - bnds(bnds)int640 1
array([0, 1])
- areacello(y, x)float32dask.array<chunksize=(218, 360), meta=np.ndarray>
- cell_methods :
- area: sum
- comment :
- Horizontal area of ocean grid cells
- long_name :
- Grid-Cell Area for Ocean Variables
- standard_name :
- cell_area
- units :
- m2
- original_key :
- CMIP.CAS.FGOALS-f3-L.historical.r1i1p1f1.Ofx.areacello.gn.gs://cmip6/CMIP6/CMIP/CAS/FGOALS-f3-L/historical/r1i1p1f1/Ofx/areacello/gn/v20190918/.nan.20190918
- parsed_with :
- xmip/postprocessing/parse_metric
Array Chunk Bytes 313.92 kB 313.92 kB Shape (218, 360) (218, 360) Count 2 Tasks 1 Chunks Type float32 numpy.ndarray
- thetao(time, lev, y, x)float32dask.array<chunksize=(10, 30, 218, 360), meta=np.ndarray>
- cell_measures :
- area: areacello volume: volcello
- cell_methods :
- area: mean where sea time: mean
- comment :
- Diagnostic should be contributed even for models using conservative temperature as prognostic field.
- long_name :
- Sea Water Potential Temperature
- standard_name :
- sea_water_potential_temperature
- units :
- degC
Array Chunk Bytes 18.65 GB 94.18 MB Shape (1980, 30, 218, 360) (10, 30, 218, 360) Count 199 Tasks 198 Chunks Type float32 numpy.ndarray
- Conventions :
- CF-1.7 CMIP-6.2
- activity_id :
- CMIP
- branch_method :
- Spin-up documentation
- branch_time_in_child :
- 674885.0
- branch_time_in_parent :
- 218635.0
- cmor_version :
- 3.4.0
- contact :
- Yongqiang Yu(yyq@lasg.iap.ac.cn)
- creation_date :
- 2019-08-22T15:40:13Z
- data_specs_version :
- 01.00.30
- experiment :
- all-forcing simulation of the recent past
- experiment_id :
- historical
- external_variables :
- areacello volcello
- forcing_index :
- 1
- frequency :
- mon
- further_info_url :
- https://furtherinfo.es-doc.org/CMIP6.CAS.FGOALS-f3-L.historical.none.r1i1p1f1
- grid :
- gs1x1
- grid_label :
- gn
- history :
- 2019-08-22T13:32:56Z ;rewrote data to be consistent with CMIP for variable uo found in table Omon.
- initialization_index :
- 1
- institution :
- Chinese Academy of Sciences, Beijing 100029, China
- institution_id :
- CAS
- license :
- CMIP6 model data produced by Lawrence Livermore PCMDI is licensed under a Creative Commons Attribution ShareAlike 4.0 International License (https://creativecommons.org/licenses). Consult https://pcmdi.llnl.gov/CMIP6/TermsOfUse for terms of use governing CMIP6 output, including citation requirements and proper acknowledgment. Further information about this data, including some limitations, can be found via the further_info_url (recorded as a global attribute in this file) and at https:///pcmdi.llnl.gov/. The data producers and data providers make no warranty, either express or implied, including, but not limited to, warranties of merchantability and fitness for a particular purpose. All liabilities arising from the supply of the information (including any liability arising in negligence) are excluded to the fullest extent permitted by law.
- mip_era :
- CMIP6
- nominal_resolution :
- 100 km
- parent_activity_id :
- CMIP
- parent_experiment_id :
- piControl
- parent_mip_era :
- CMIP6
- parent_source_id :
- FGOALS-f3-L
- parent_time_units :
- days since 0001-01-01
- parent_variant_label :
- r1i1p1f1
- physics_index :
- 1
- product :
- model-output
- realization_index :
- 1
- realm :
- ocean
- references :
- Model described by Yu et al.2019,
- run_variant :
- forcing: black carbon aerosol only
- source :
- FGOALS-f3-L (2017): aerosol: none atmos: FAMIL2.2 (Cubed-sphere, c96; 360 x 180 longitude/latitude; 32 levels; top level 2.16 hPa) atmosChem: none land: CLM4.0 landIce: none ocean: LICOM3.0 (LICOM3.0, tripolar primarily 1deg; 360 x 218 longitude/latitude; 30 levels; top grid cell 0-10 m) ocnBgchem: none seaIce: CICE4.0
- source_id :
- FGOALS-f3-L
- source_type :
- AOGCM
- sub_experiment :
- none
- sub_experiment_id :
- none
- table_id :
- Omon
- table_info :
- Creation Date:(09 May 2019) MD5:cde930676e68ac6780d5e4c62d3898f6
- title :
- FGOALS-f3-L output prepared for CMIP6
- tracking_id :
- hdl:21.14100/1cddc583-15f9-4315-b09b-1bc2cef61986 hdl:21.14100/eb8fba34-abaf-4e65-ae4c-d50615ade988 hdl:21.14100/3e2f4f75-1b24-4f8d-9de0-37f11b66c652
- variable_id :
- thetao
- variant_label :
- r1i1p1f1
- status :
- 2019-10-25;created;by nhn2@columbia.edu
- netcdf_tracking_ids :
- hdl:21.14100/1cddc583-15f9-4315-b09b-1bc2cef61986 hdl:21.14100/eb8fba34-abaf-4e65-ae4c-d50615ade988 hdl:21.14100/3e2f4f75-1b24-4f8d-9de0-37f11b66c652
- version_id :
- v20190822
- intake_esm_varname :
- None
- intake_esm_dataset_key :
- CMIP.CAS.FGOALS-f3-L.historical.r1i1p1f1.Omon.thetao.gn.gs://cmip6/CMIP6/CMIP/CAS/FGOALS-f3-L/historical/r1i1p1f1/Omon/thetao/gn/v20190822/.nan.20190822
You can see that the r2i1p1f1 member was not matched, while r1i1p1f1 was.
Putting it all together
Ok it is time for a more high level example!
Lets look at the global mean surface temperature for ALL available models, not just one. The process is pretty much exactly the same, you only have to modify your initial .search() query for both the data and the metrics.
I temporarily had to exclude a single member, due to a bug with intake-esm (see here for details).
[29]:
experiment_id = 'ssp585'
cat_data = col.search(variable_id='tos', experiment_id=experiment_id, grid_label='gn', table_id='Omon')
##### remove a single store
# see https://github.com/intake/intake-esm/issues/246 for details on how to modify the dataframe
df = cat_data.df
drop_idx = cat_data.df.index[cat_data.df['zstore'].str.contains('ScenarioMIP.CCCma.CanESM5.ssp585.r9i1p1f1.Omon.tos.gn')]
df = df.drop(drop_idx)
cat_data = cat_data.from_df(df=df, esmcol_data=cat_data.esmcol_data)
#####
ddict = cat_data.to_dataset_dict(**kwargs)
cat_metric = col.search(variable_id='areacello', experiment_id=experiment_id, grid_label='gn')
ddict_metrics = cat_metric.to_dataset_dict(**kwargs)
ddict_matched = match_metrics(ddict, ddict_metrics, ['areacello'], print_statistics=True)
# remove the datasets where the parsing was unsuccesful
ddict_matched_filtered = {k:ds for k,ds in ddict_matched.items() if 'areacello' in ds.variables}
--> The keys in the returned dictionary of datasets are constructed as follows:
'activity_id.institution_id.source_id.experiment_id.member_id.table_id.variable_id.grid_label.zstore.dcpp_init_year.version'
/Users/juliusbusecke/code/xmip/xmip/preprocessing.py:267: UserWarning: `FGOALS-f3-L` does not provide lon or lat bounds.
  warnings.warn("`FGOALS-f3-L` does not provide lon or lat bounds.")
/Users/juliusbusecke/code/xmip/xmip/preprocessing.py:267: UserWarning: `FGOALS-f3-L` does not provide lon or lat bounds.
  warnings.warn("`FGOALS-f3-L` does not provide lon or lat bounds.")
/Users/juliusbusecke/code/xmip/xmip/preprocessing.py:267: UserWarning: `FGOALS-f3-L` does not provide lon or lat bounds.
warnings.warn("`FGOALS-f3-L` does not provide lon or lat bounds.")
--> The keys in the returned dictionary of datasets are constructed as follows:
        'activity_id.institution_id.source_id.experiment_id.member_id.table_id.variable_id.grid_label.zstore.dcpp_init_year.version'
Processed 272 datasets.
Exact matches:{'areacello': 0}
Other matches:{'areacello': 239}
No match found:{'areacello': 33}
/Users/juliusbusecke/code/xmip/xmip/postprocessing.py:126: UserWarning: No matching metrics found for areacello
  warnings.warn(f"No matching metrics found for {mv}")
We have 272 datasets to start with, only 184 area outputs, but we were able to match 239 of the datasets with a metric! The ones without metrics needed to be removed for plotting.
Executing this plot takes a while. As always, ☕️ time
[42]:
models = np.sort(cat_metric.df['source_id'].unique())
fig, axarr = plt.subplots(ncols=6, nrows=5, figsize=[16, 8], sharex=True, sharey=True)
for model, ax in zip(models, axarr.flat):
    ddict_model = {k:ds for k,ds in ddict_matched_filtered.items() if model in k}
    for i, ds in enumerate(ddict_model.values()):
        pass
        # calculate the area weighted mean surface ocean temperature
        da = ds.tos.sel(time=slice('2000', '2100')).weighted(ds.areacello.fillna(0)).mean(['x','y', 'lev']).squeeze().load()
        # resample to 3month averages
        da = da.resample(time='3MS').mean()
        da.plot(ax=ax, color=f'C{1}', label=ds.attrs['variant_label'], alpha=0.5)
    ax.text(0.03,0.97,model,ha='left',va='top', transform=ax.transAxes)
    ax.set_xlabel('')
    ax.grid()
fig.subplots_adjust(hspace=0, wspace=0)
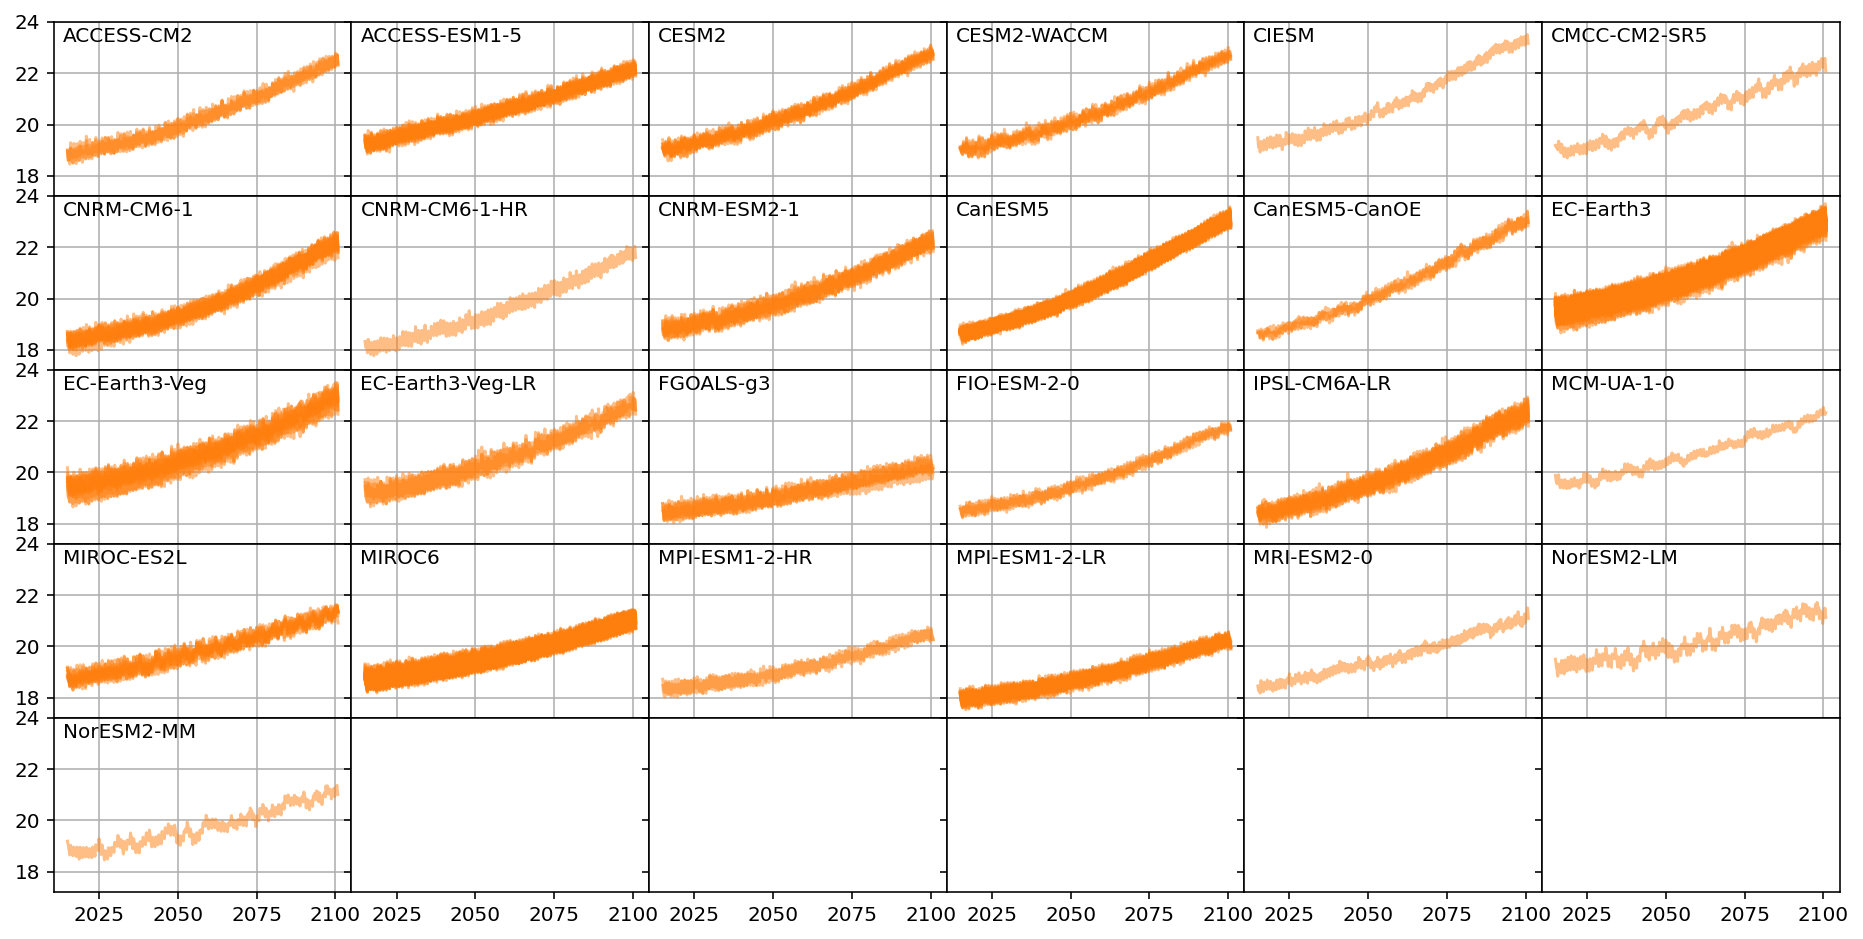
Some interesting differences between models in terms of the mean temperature at the end of the century, but also in terms of variability.
I that if you are trying to work with many different models and grids this should make your life a little bit easier.